
Persistent settings
To allow Mosaiq Insight users to start wide and then drill into their data, certain settings will stay persistent as users navigate deeper into the data. Namely the date range and the operators/services selected.
1) Calendar guide

The calendar can be found at the top left of the KPI dashboard (1).
About the calendar
The calendar has some pre-set options to the left column of the window, or you can zero in on specific dates.
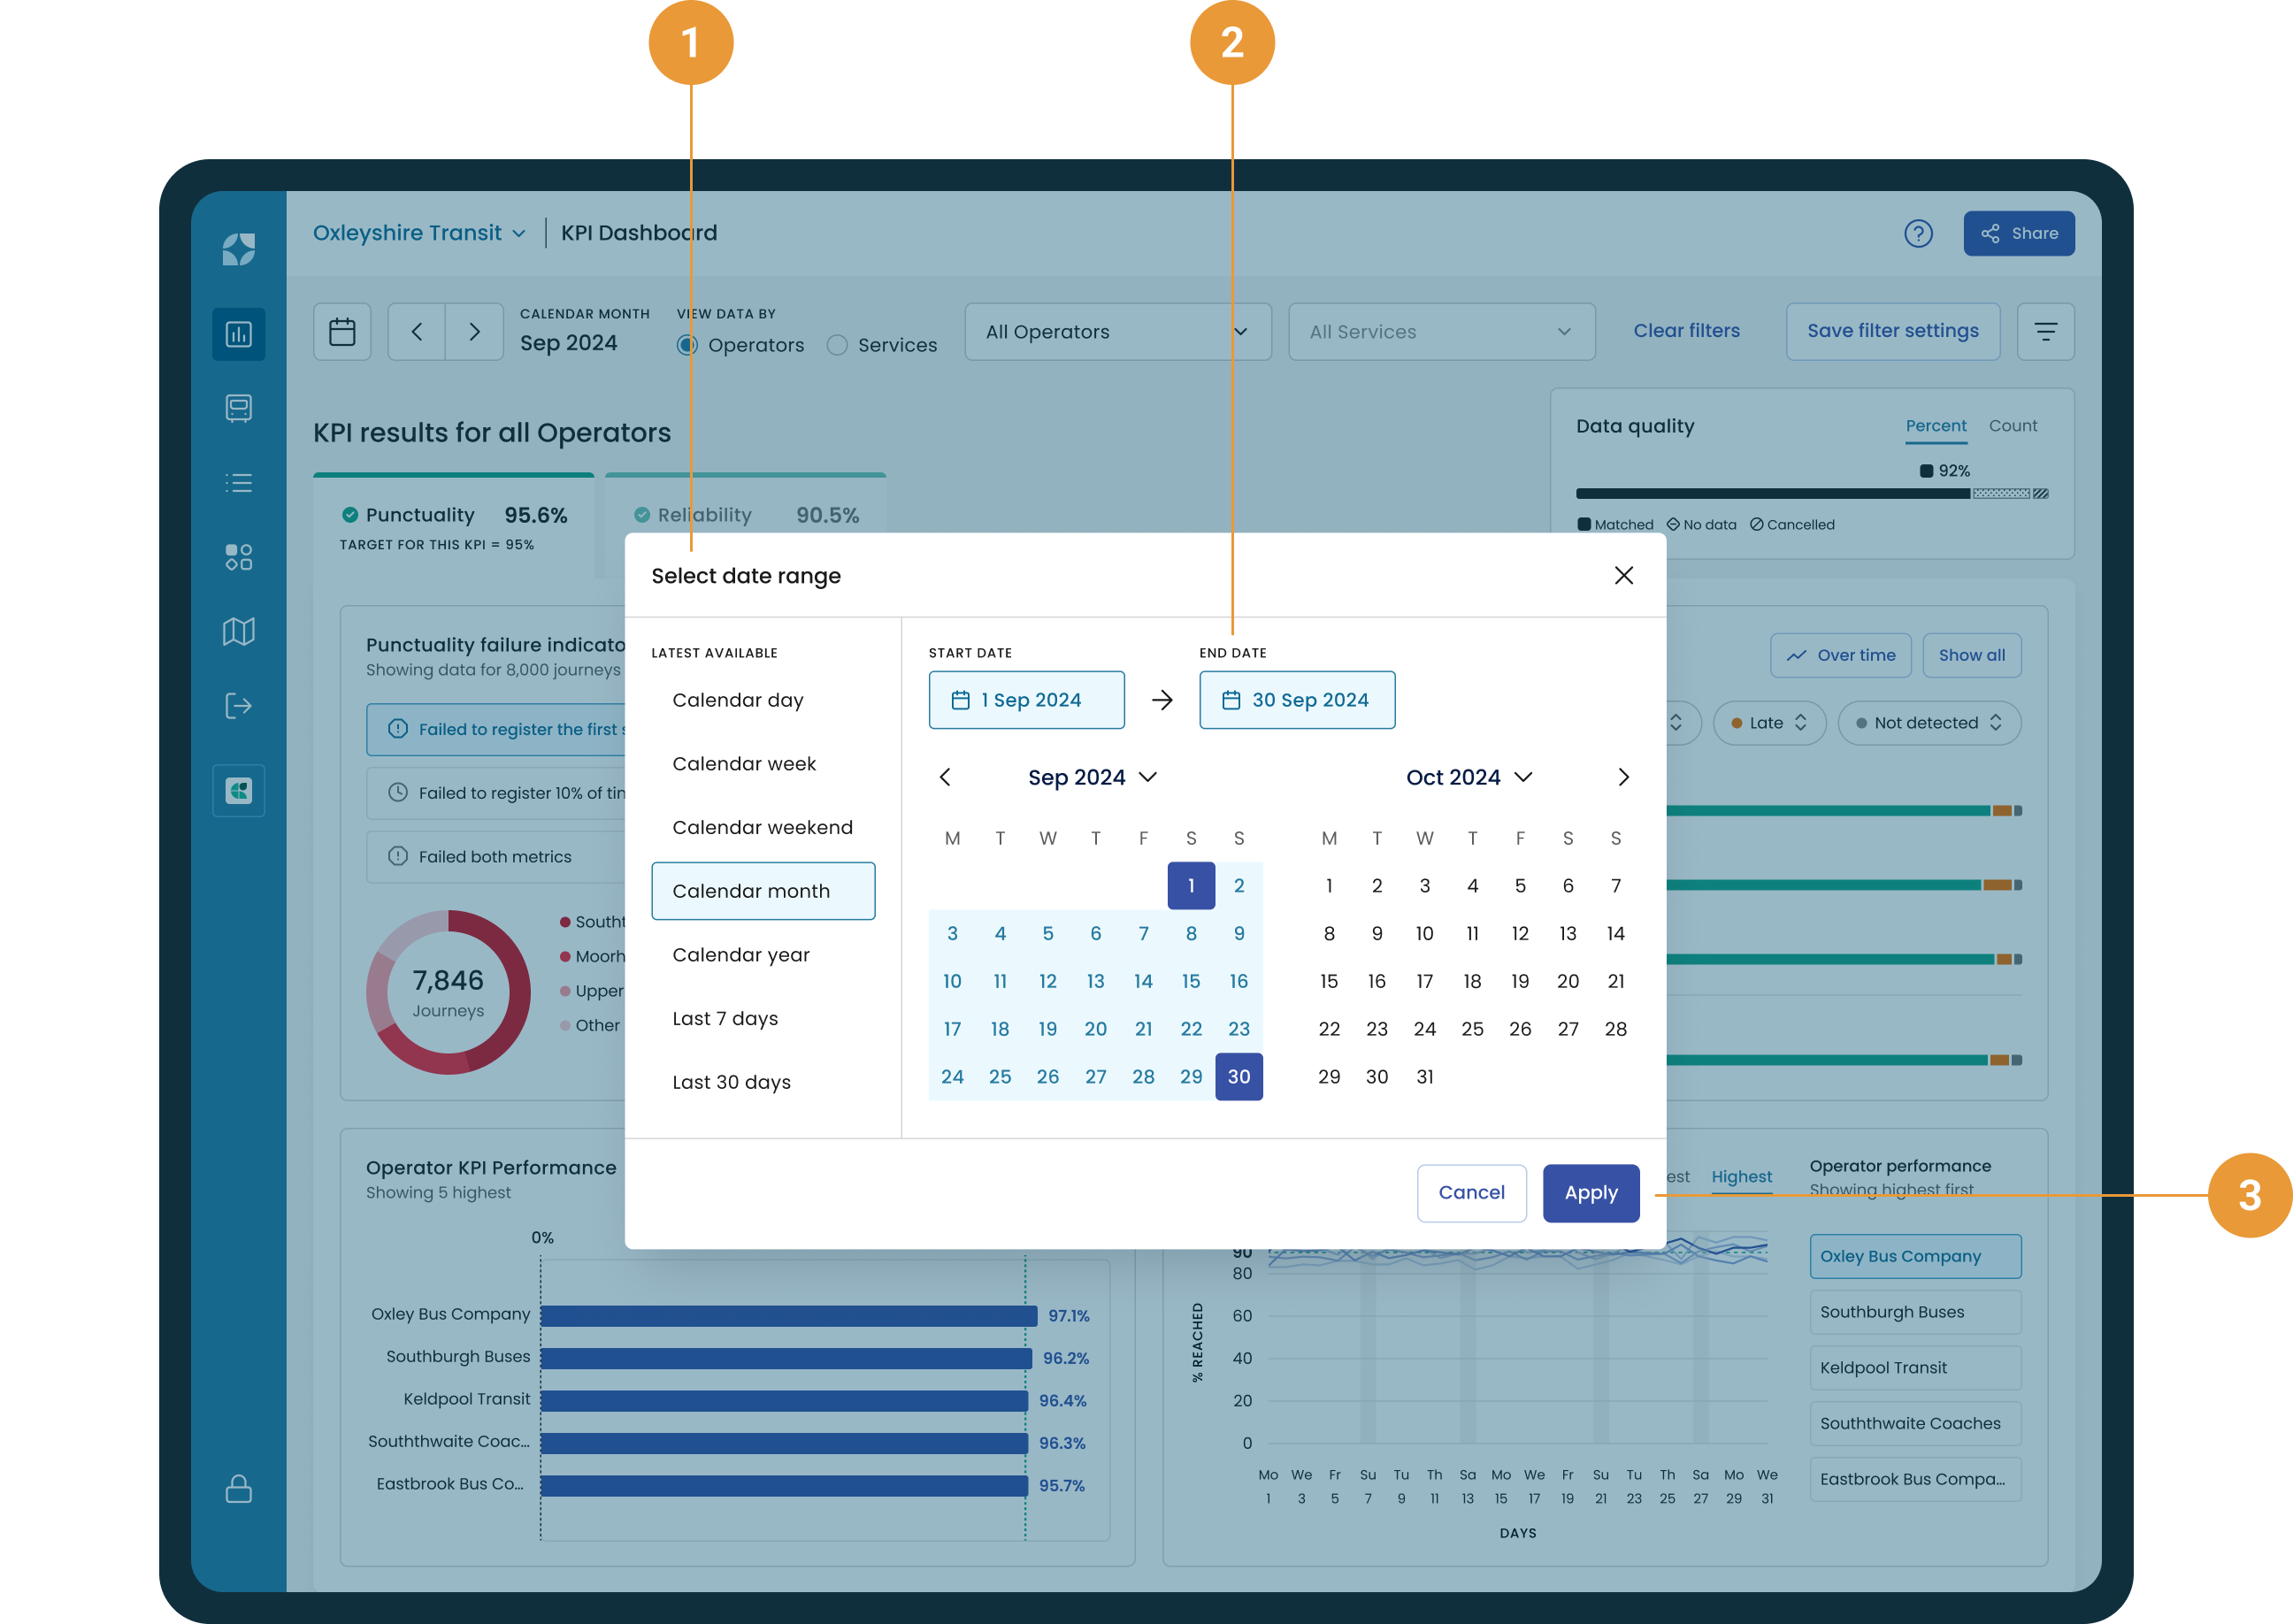
The calendar defaults to showing the latest available calendar month data. To see a different range of historical data:
Select a date range from the pre-set options on the left (1) Or select a custom date range (2) Click “apply” to apply your date range or cancel (3).
To cancel your selection and return to the KPI dashboard without amending the date range, click “cancel” or the “X” to the top right of the window.
The date range you’ve selected stays persistent as you drill down further through Mosaiq Insights
Changing the pre-set date range
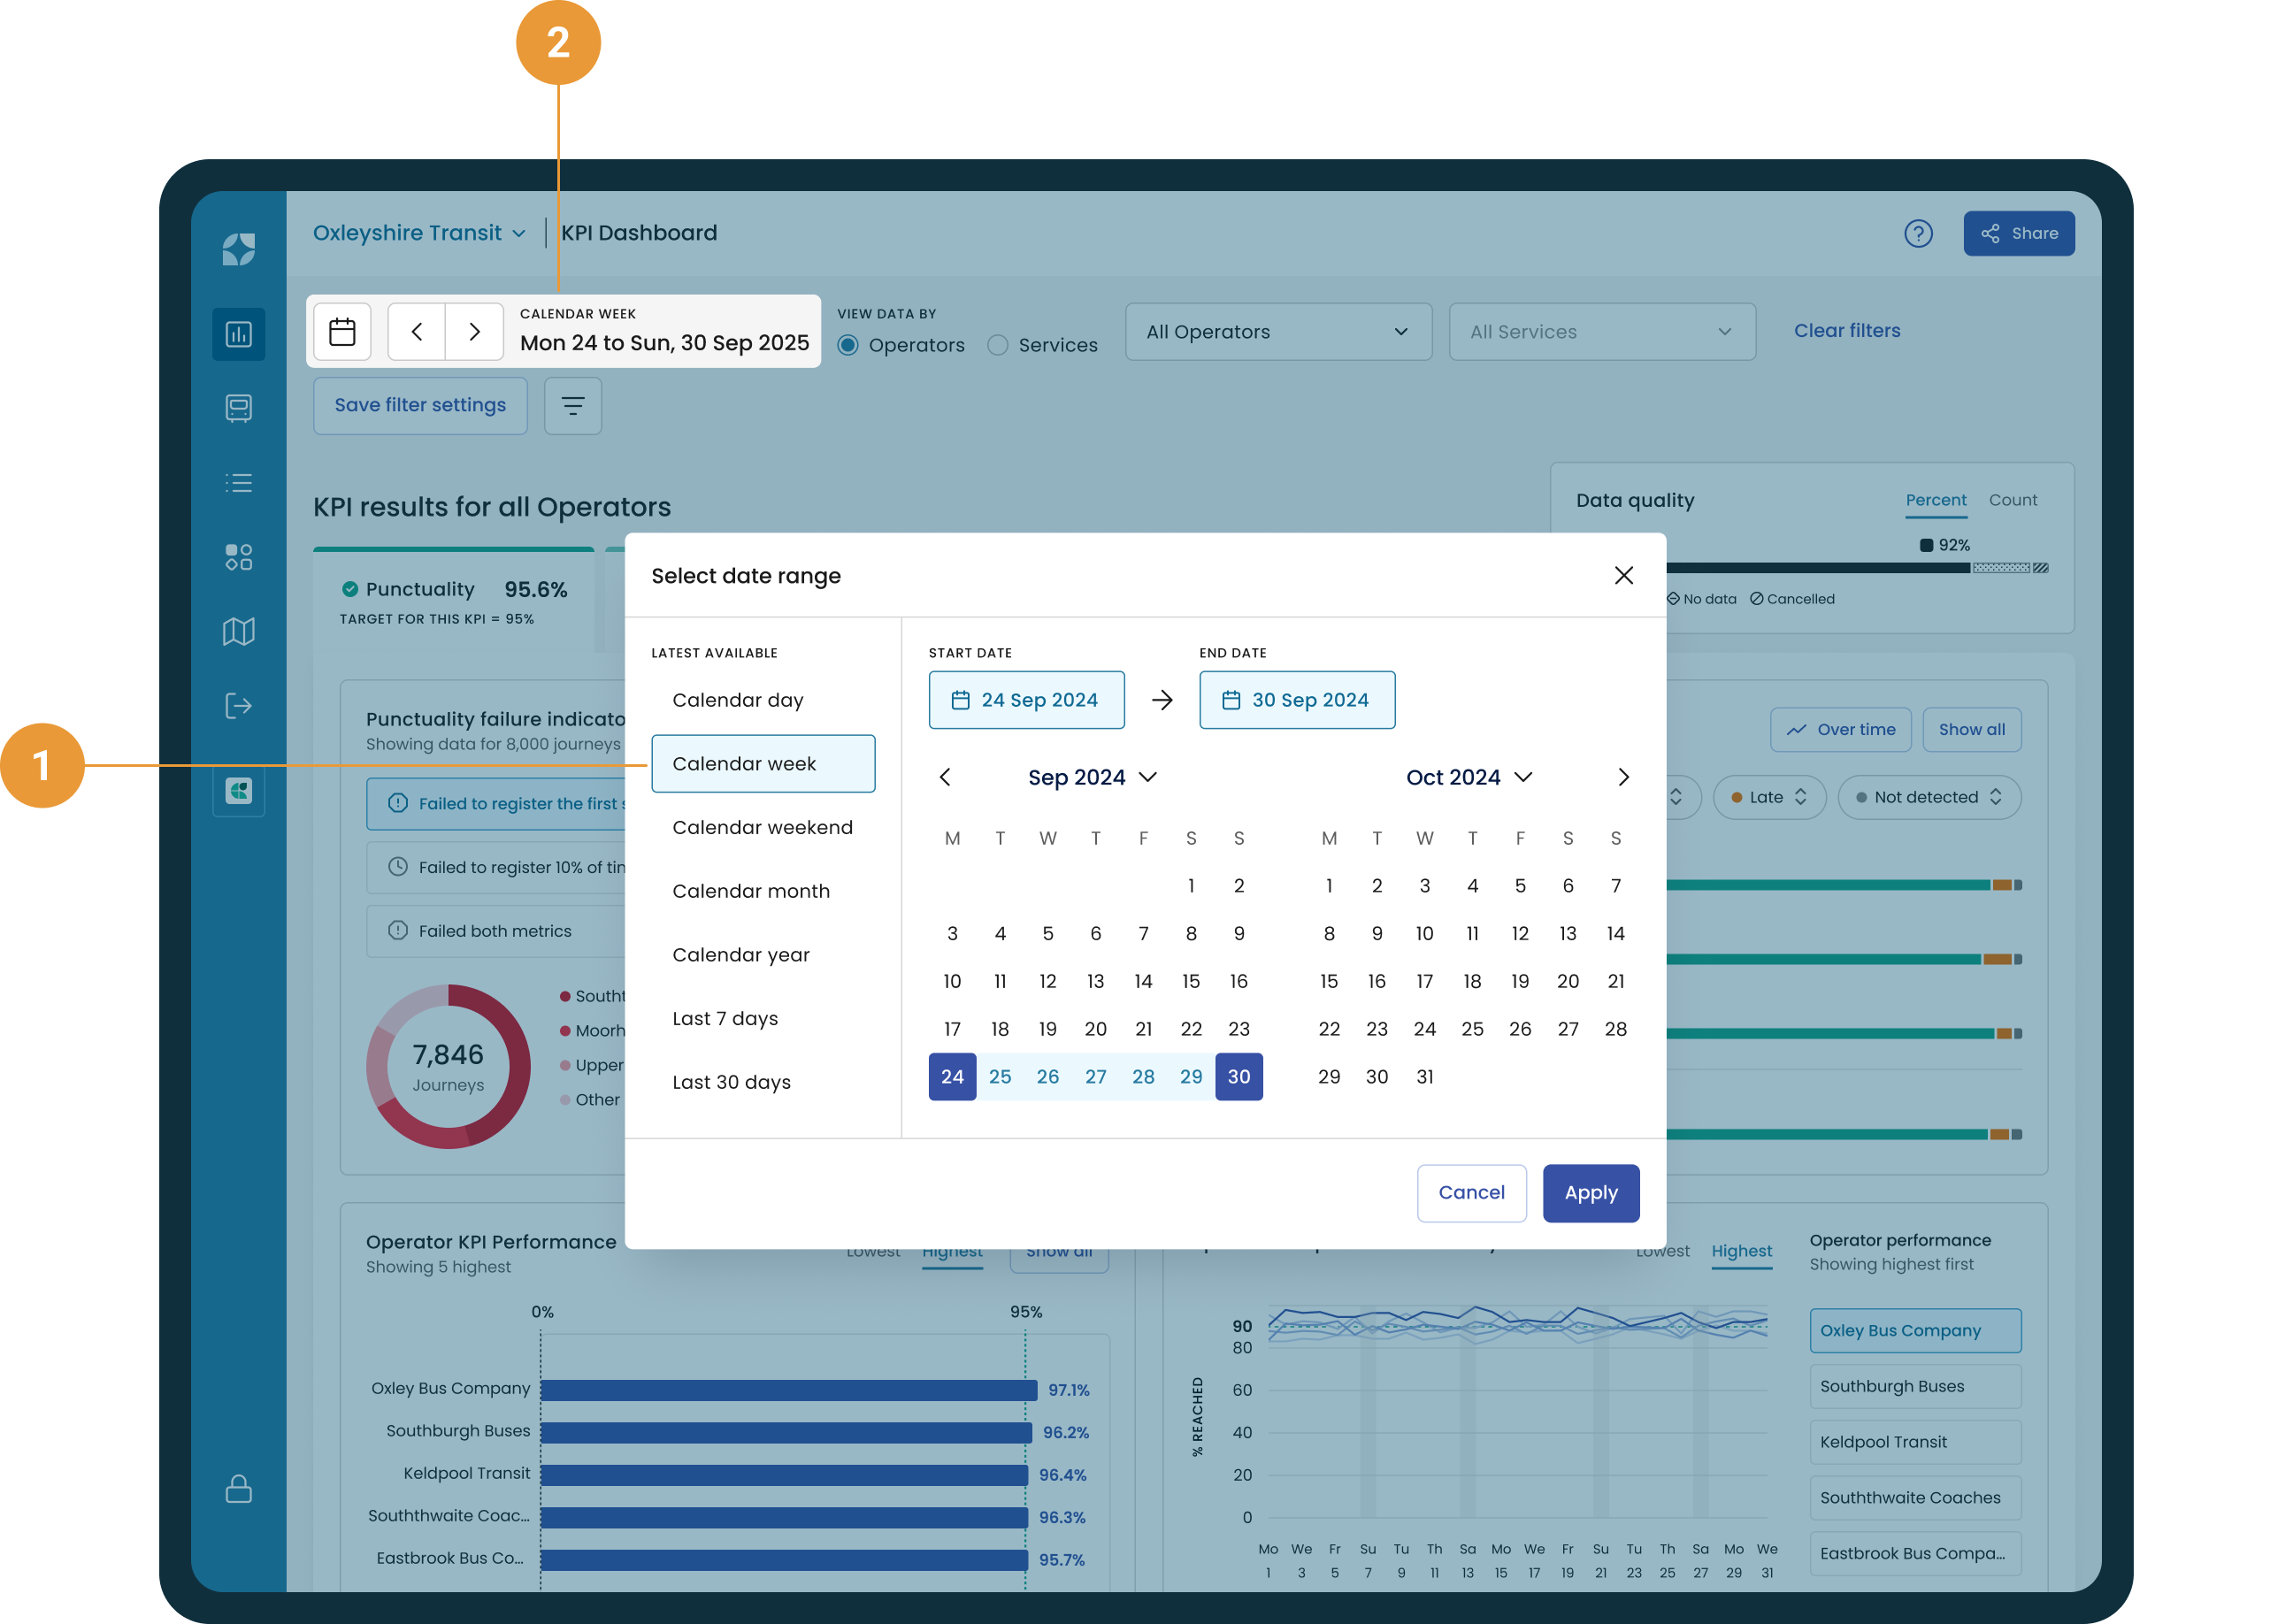
In the calendar we’ve changed the preset range for the latest available data from ”calendar month” data to “calendar week” data. By selecting calendar week, the calendar week’s data will be displayed – this will always default to being the latest available data.
After we “apply” our selection, we will see on the KPI Dashboard that the selected preset date range has changed from “calendar month“ to “calendar week” and the performance data displayed in the KPI dashboard charts will have updated to reflect this change .
EXAMPLE #1

We can apply a custom date range by selecting a start and end date in the calendar picker. The performance data displayed on the KPI dashboard charts will update to reflect this change, and the label would also update to indicate that a custom date range has been applied.
Toggling through date ranges
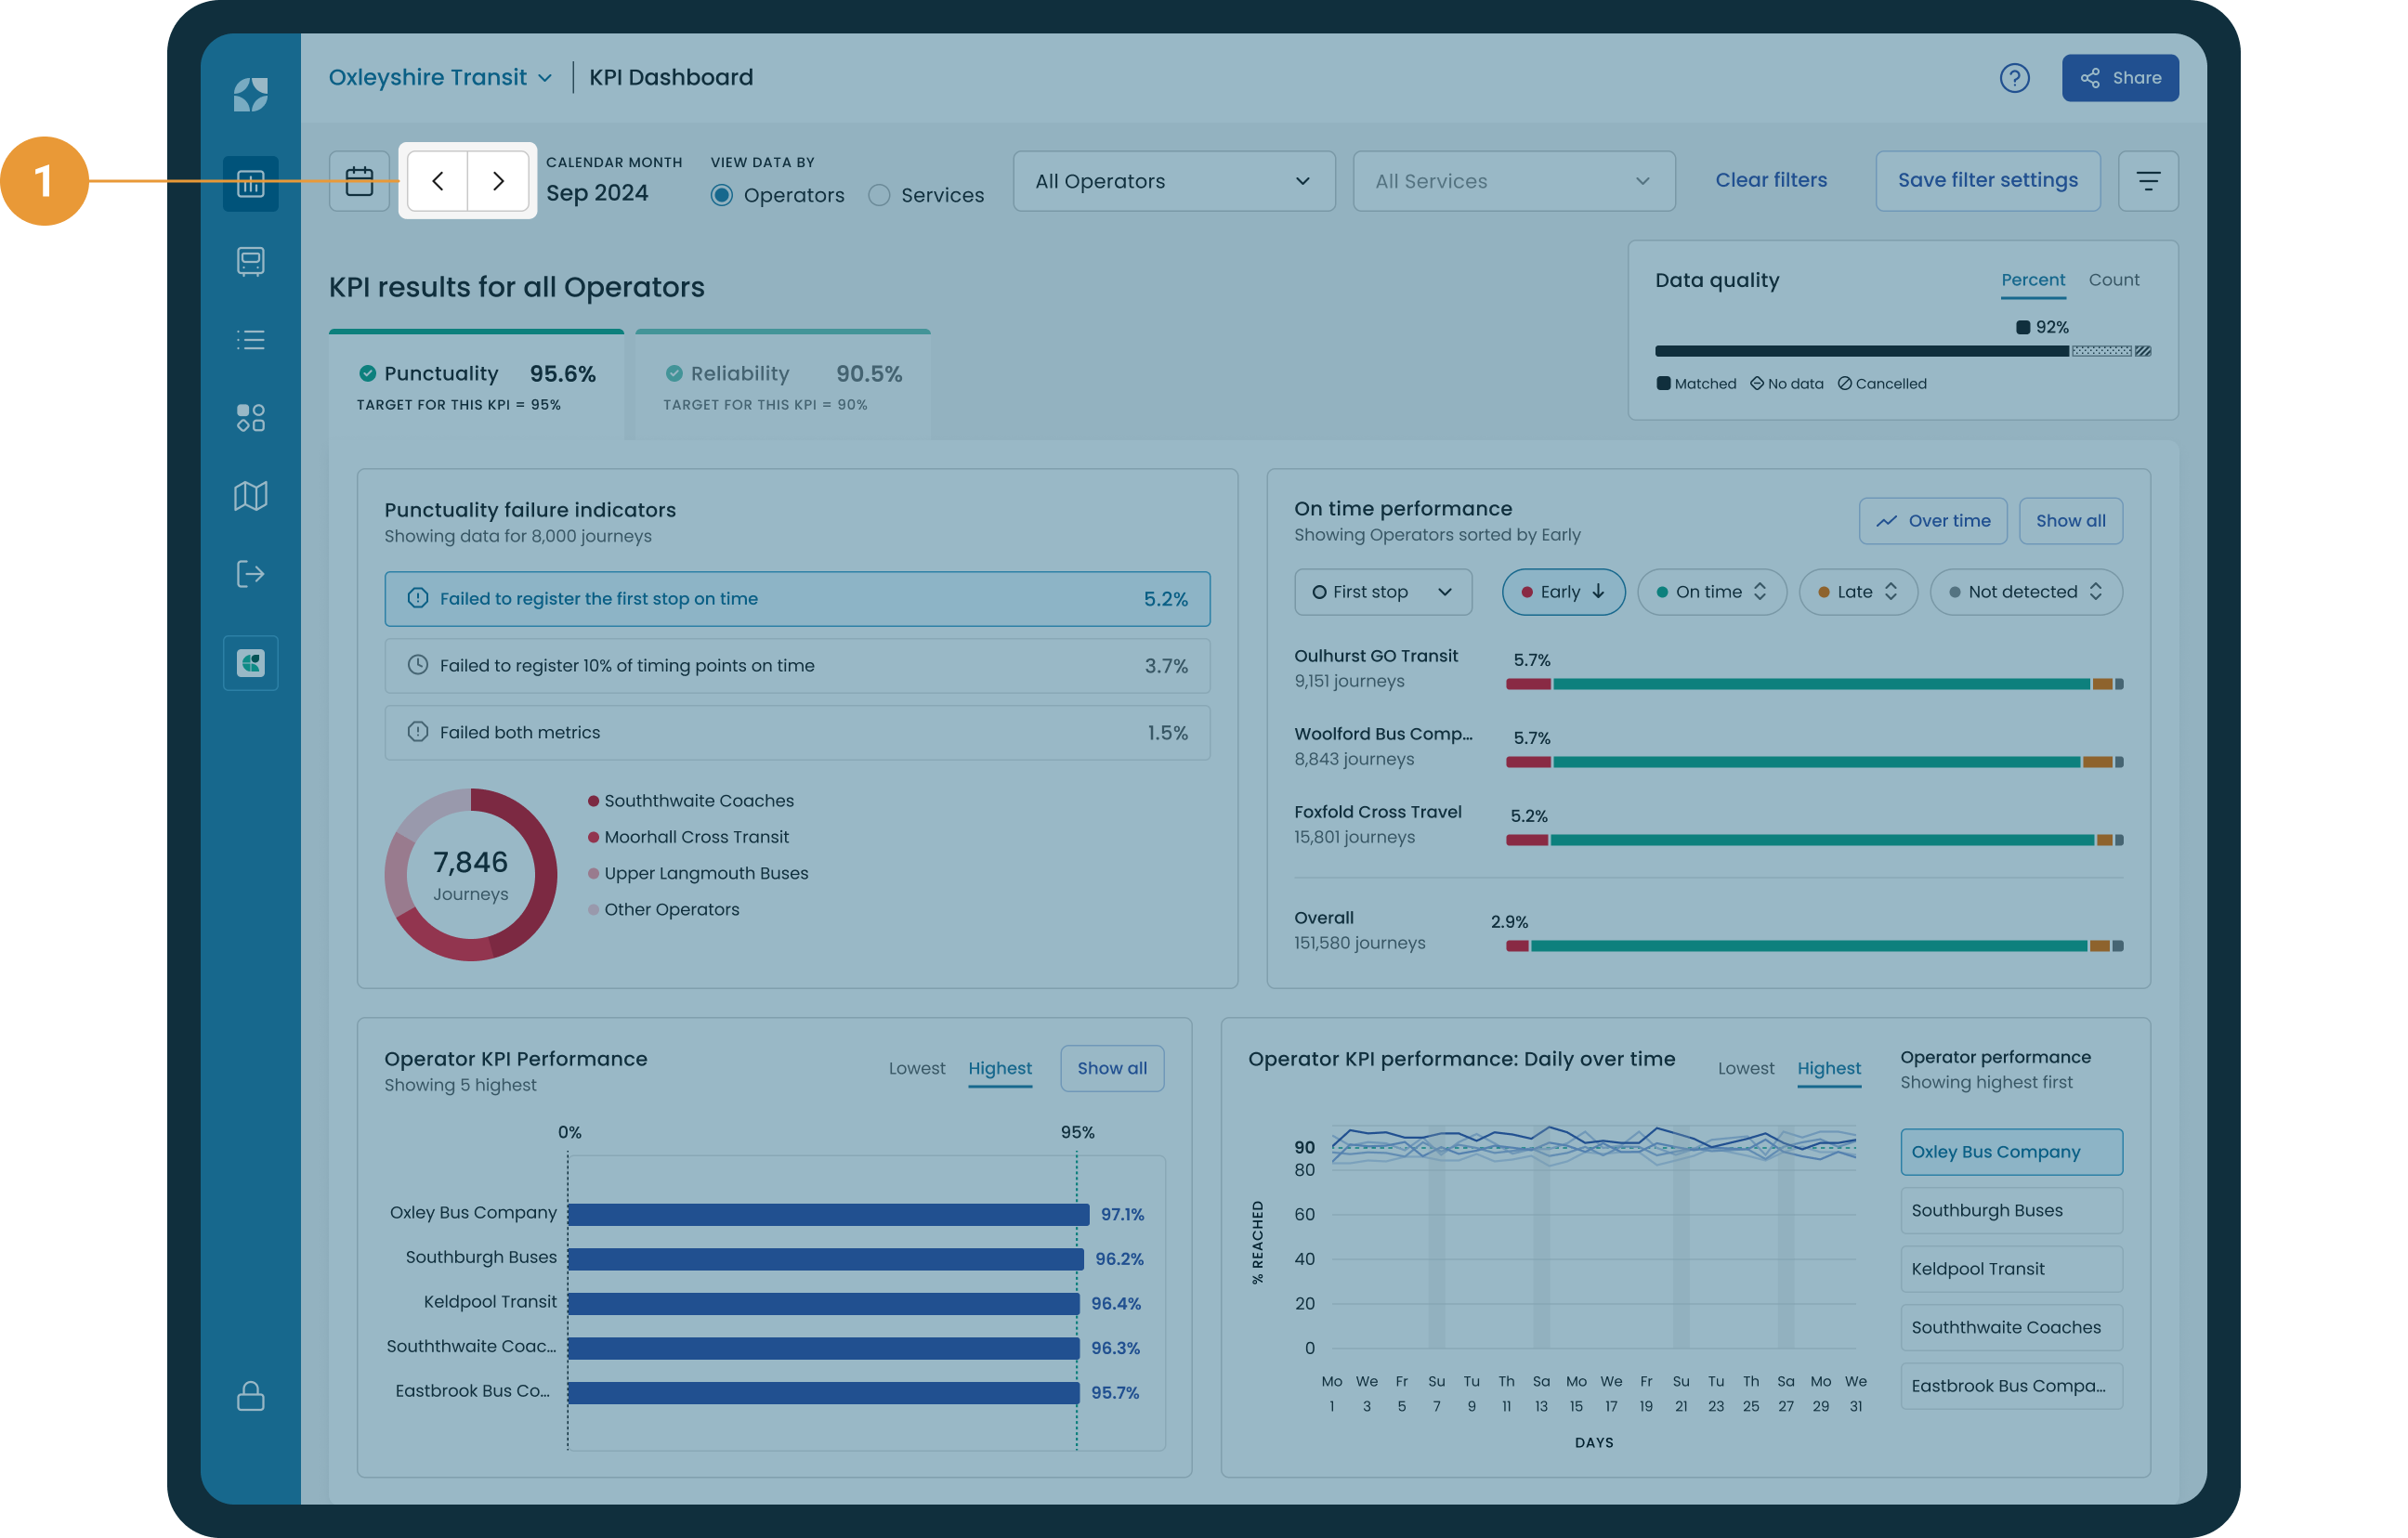
Click the left and right arrows to toggle through performance data in your selected date range blocks (1).
EXAMPLE #2

Performance data is being shown for the calendar month of “May 2023”. All data shown on the KPI Dashboard will be from 01 to 31 May. Using the left and right tabs will shift the performance data shown in the charts backwards and forwards in time by one calendar month.
EXAMPLE #3
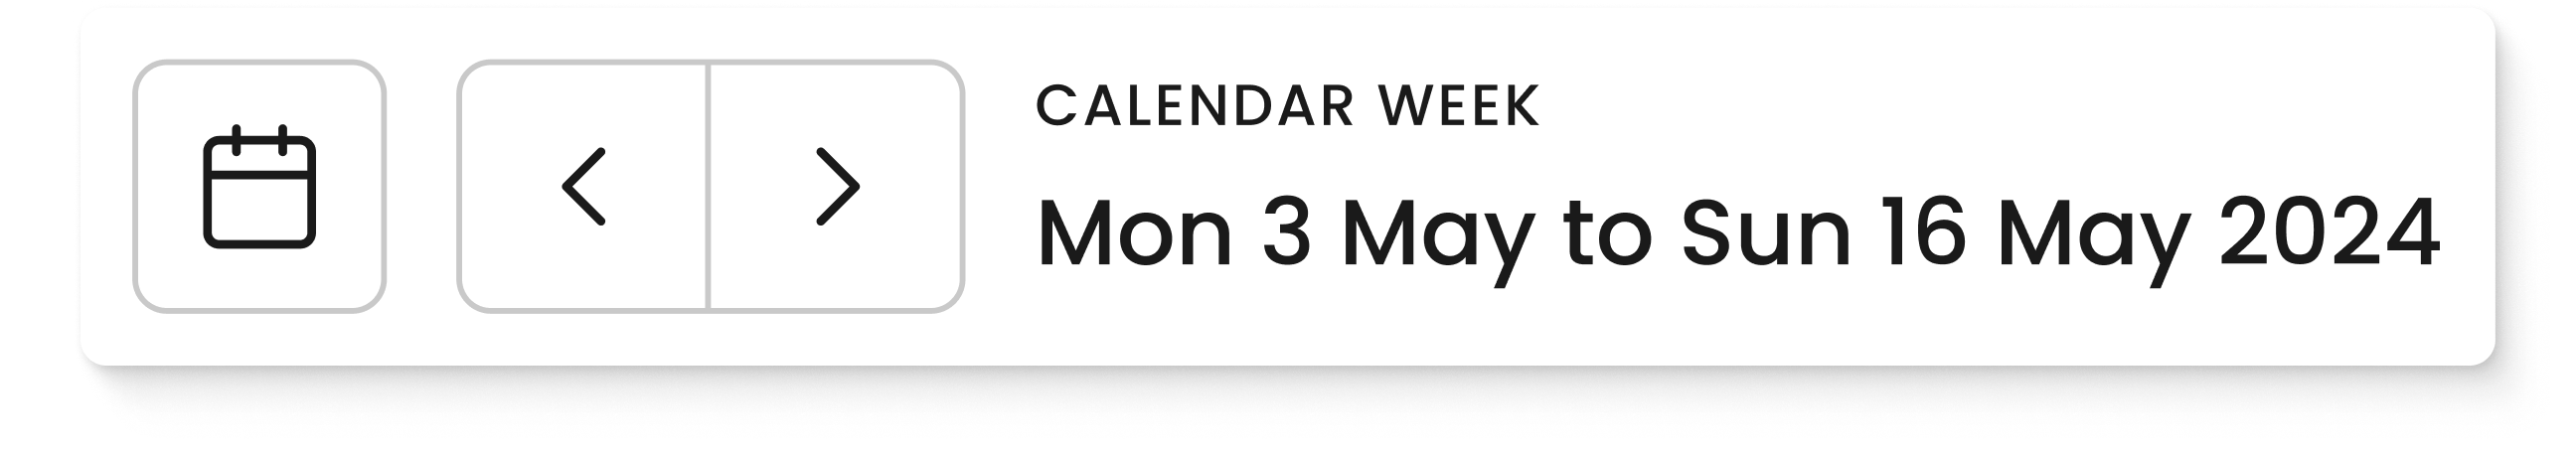
Performance data is being shown for a custom date range of 01 to 16 May 2023. All data shown on the KPI Dashboard will be from 01 to 16 May 2023. Using the left and right tabs will shift the performance data shown in the charts backwards and forwards in time by the same sized time block: tabbing forwards in time would show 17 May to 01 June 2023, backwards would show 15 to 30 April 2023.
Viewing data by operator or service
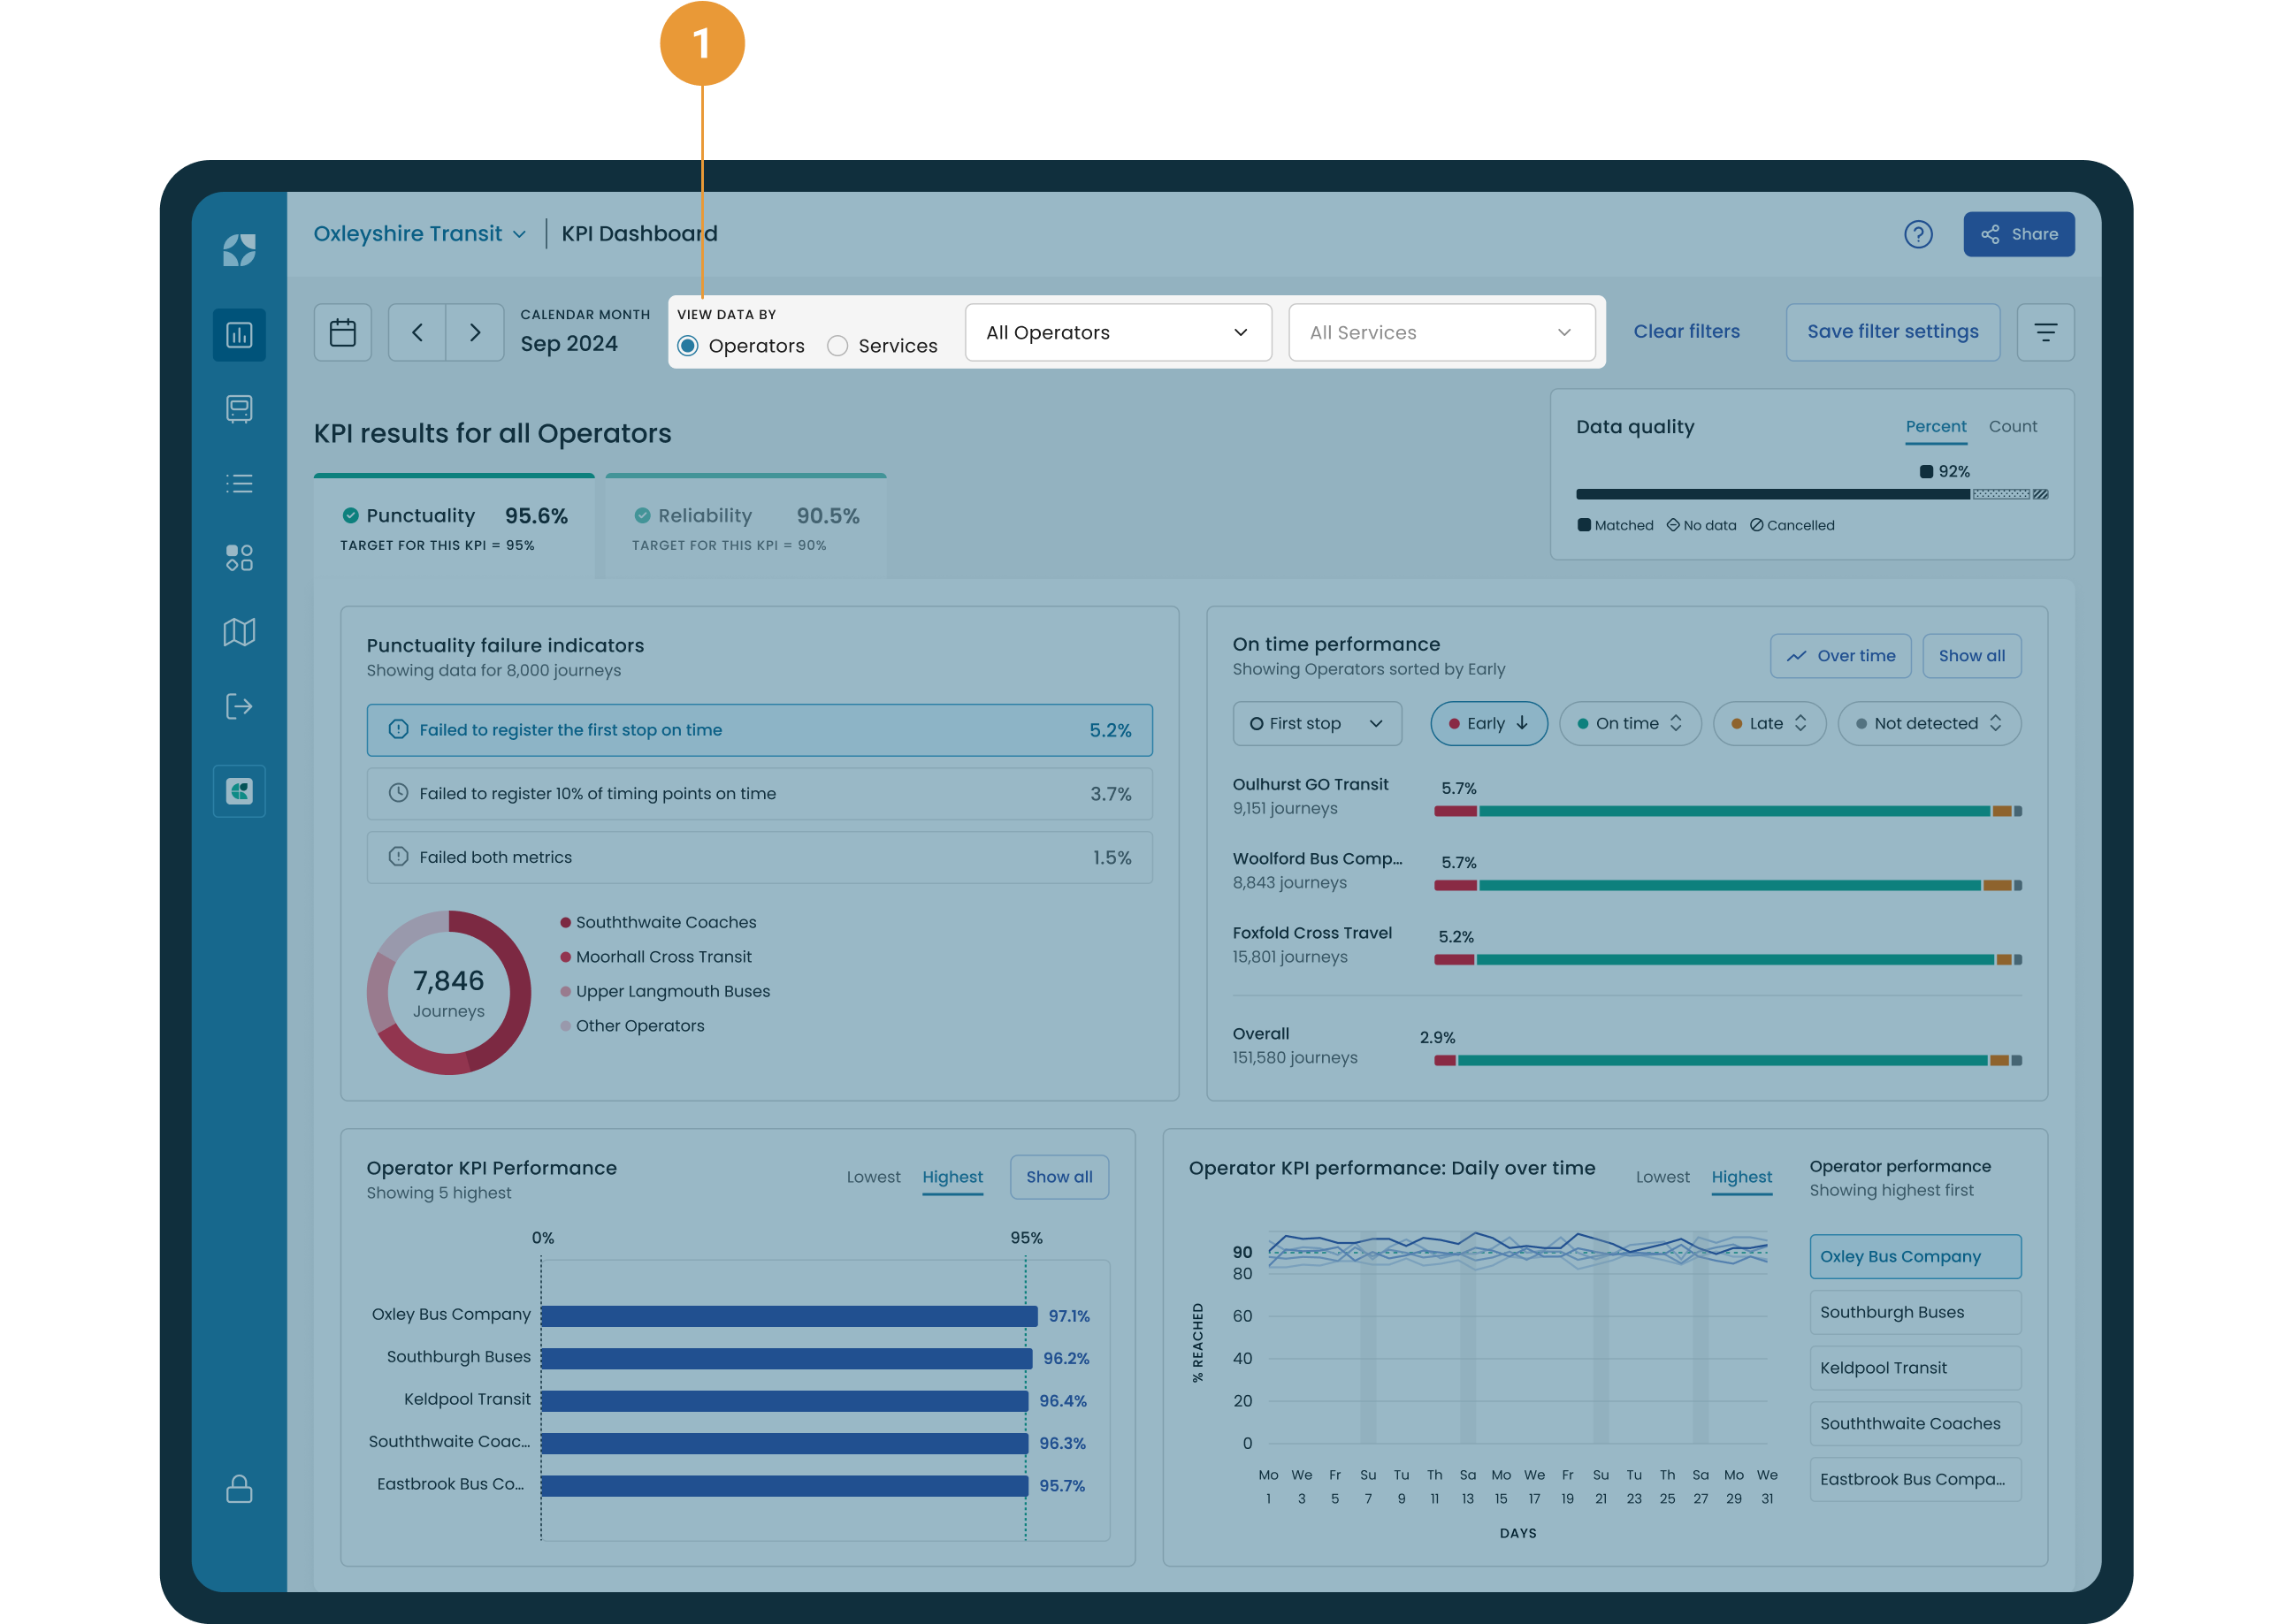
View the KPI Dashboard performance data either by operators or services and choose which operators and services to include (1).
2) Filter the view by operators
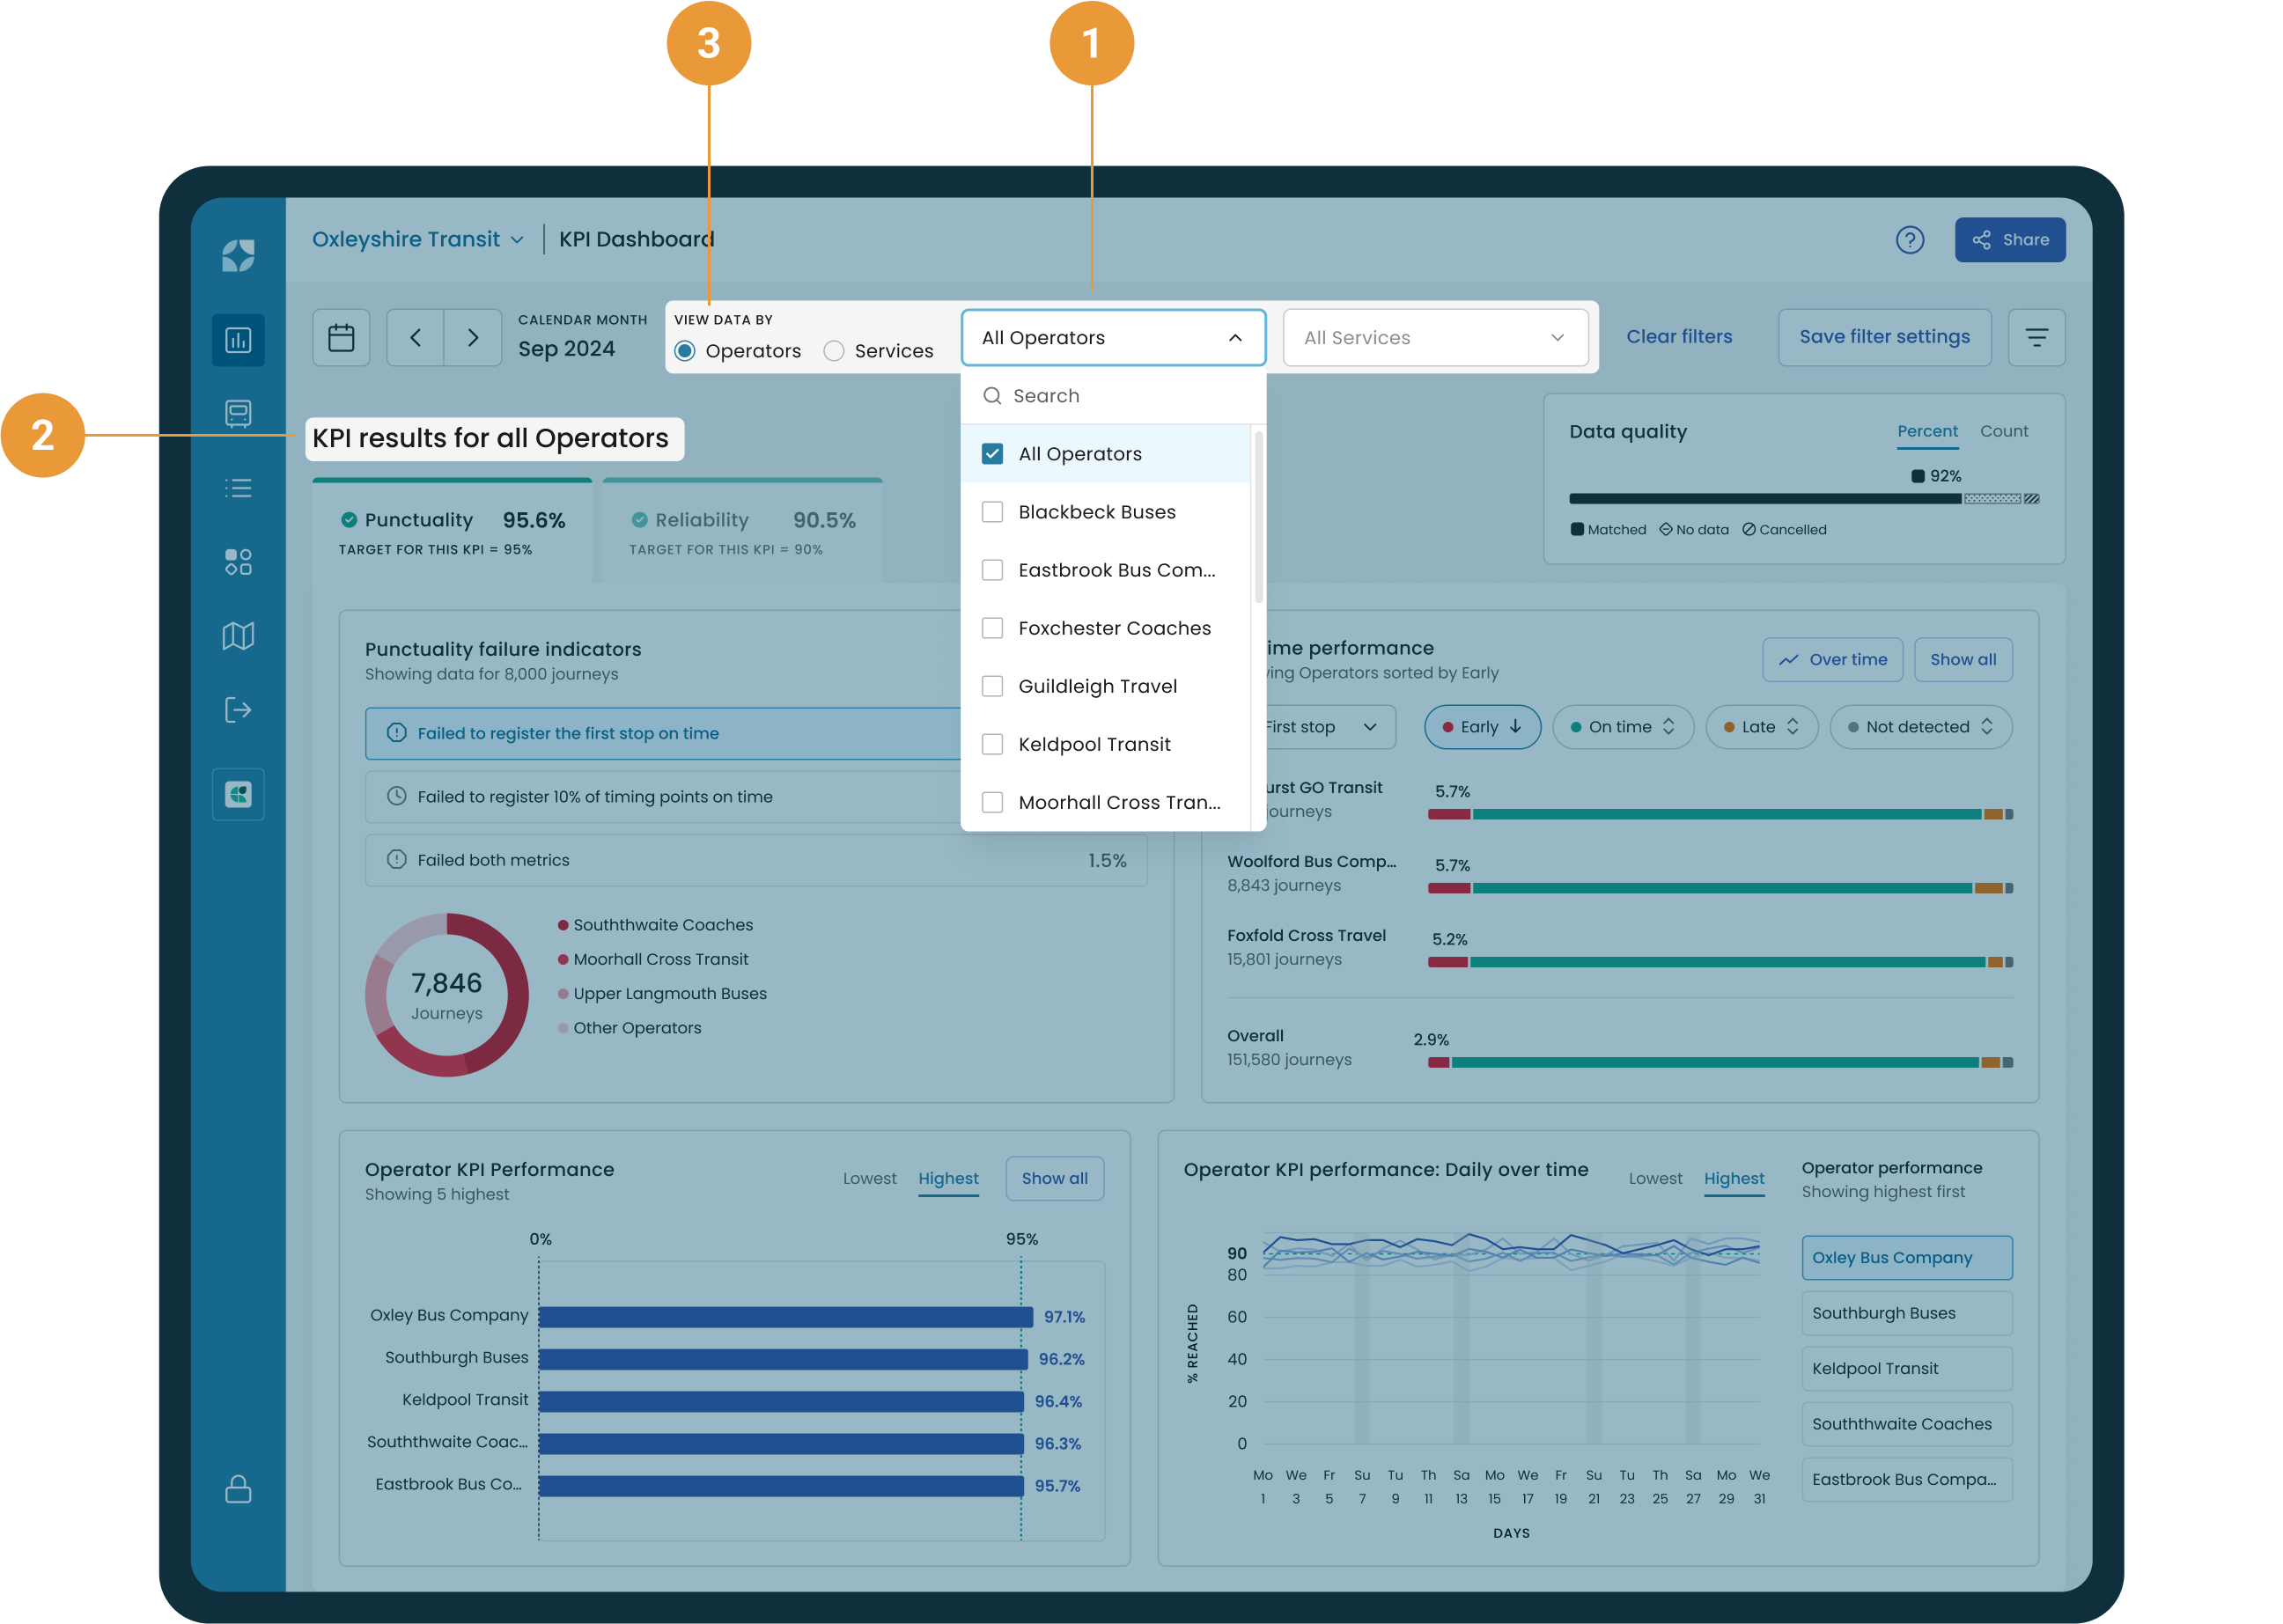
Dial in whichever operators you want to view data for by selecting them from the first dropdown (1).
The selected operator/number of operators will be summarized in the KPI results header (2).
Toggle how you want to view the data you’ve selected on the dashboard – either by operators or services (3).
Filter the view by services
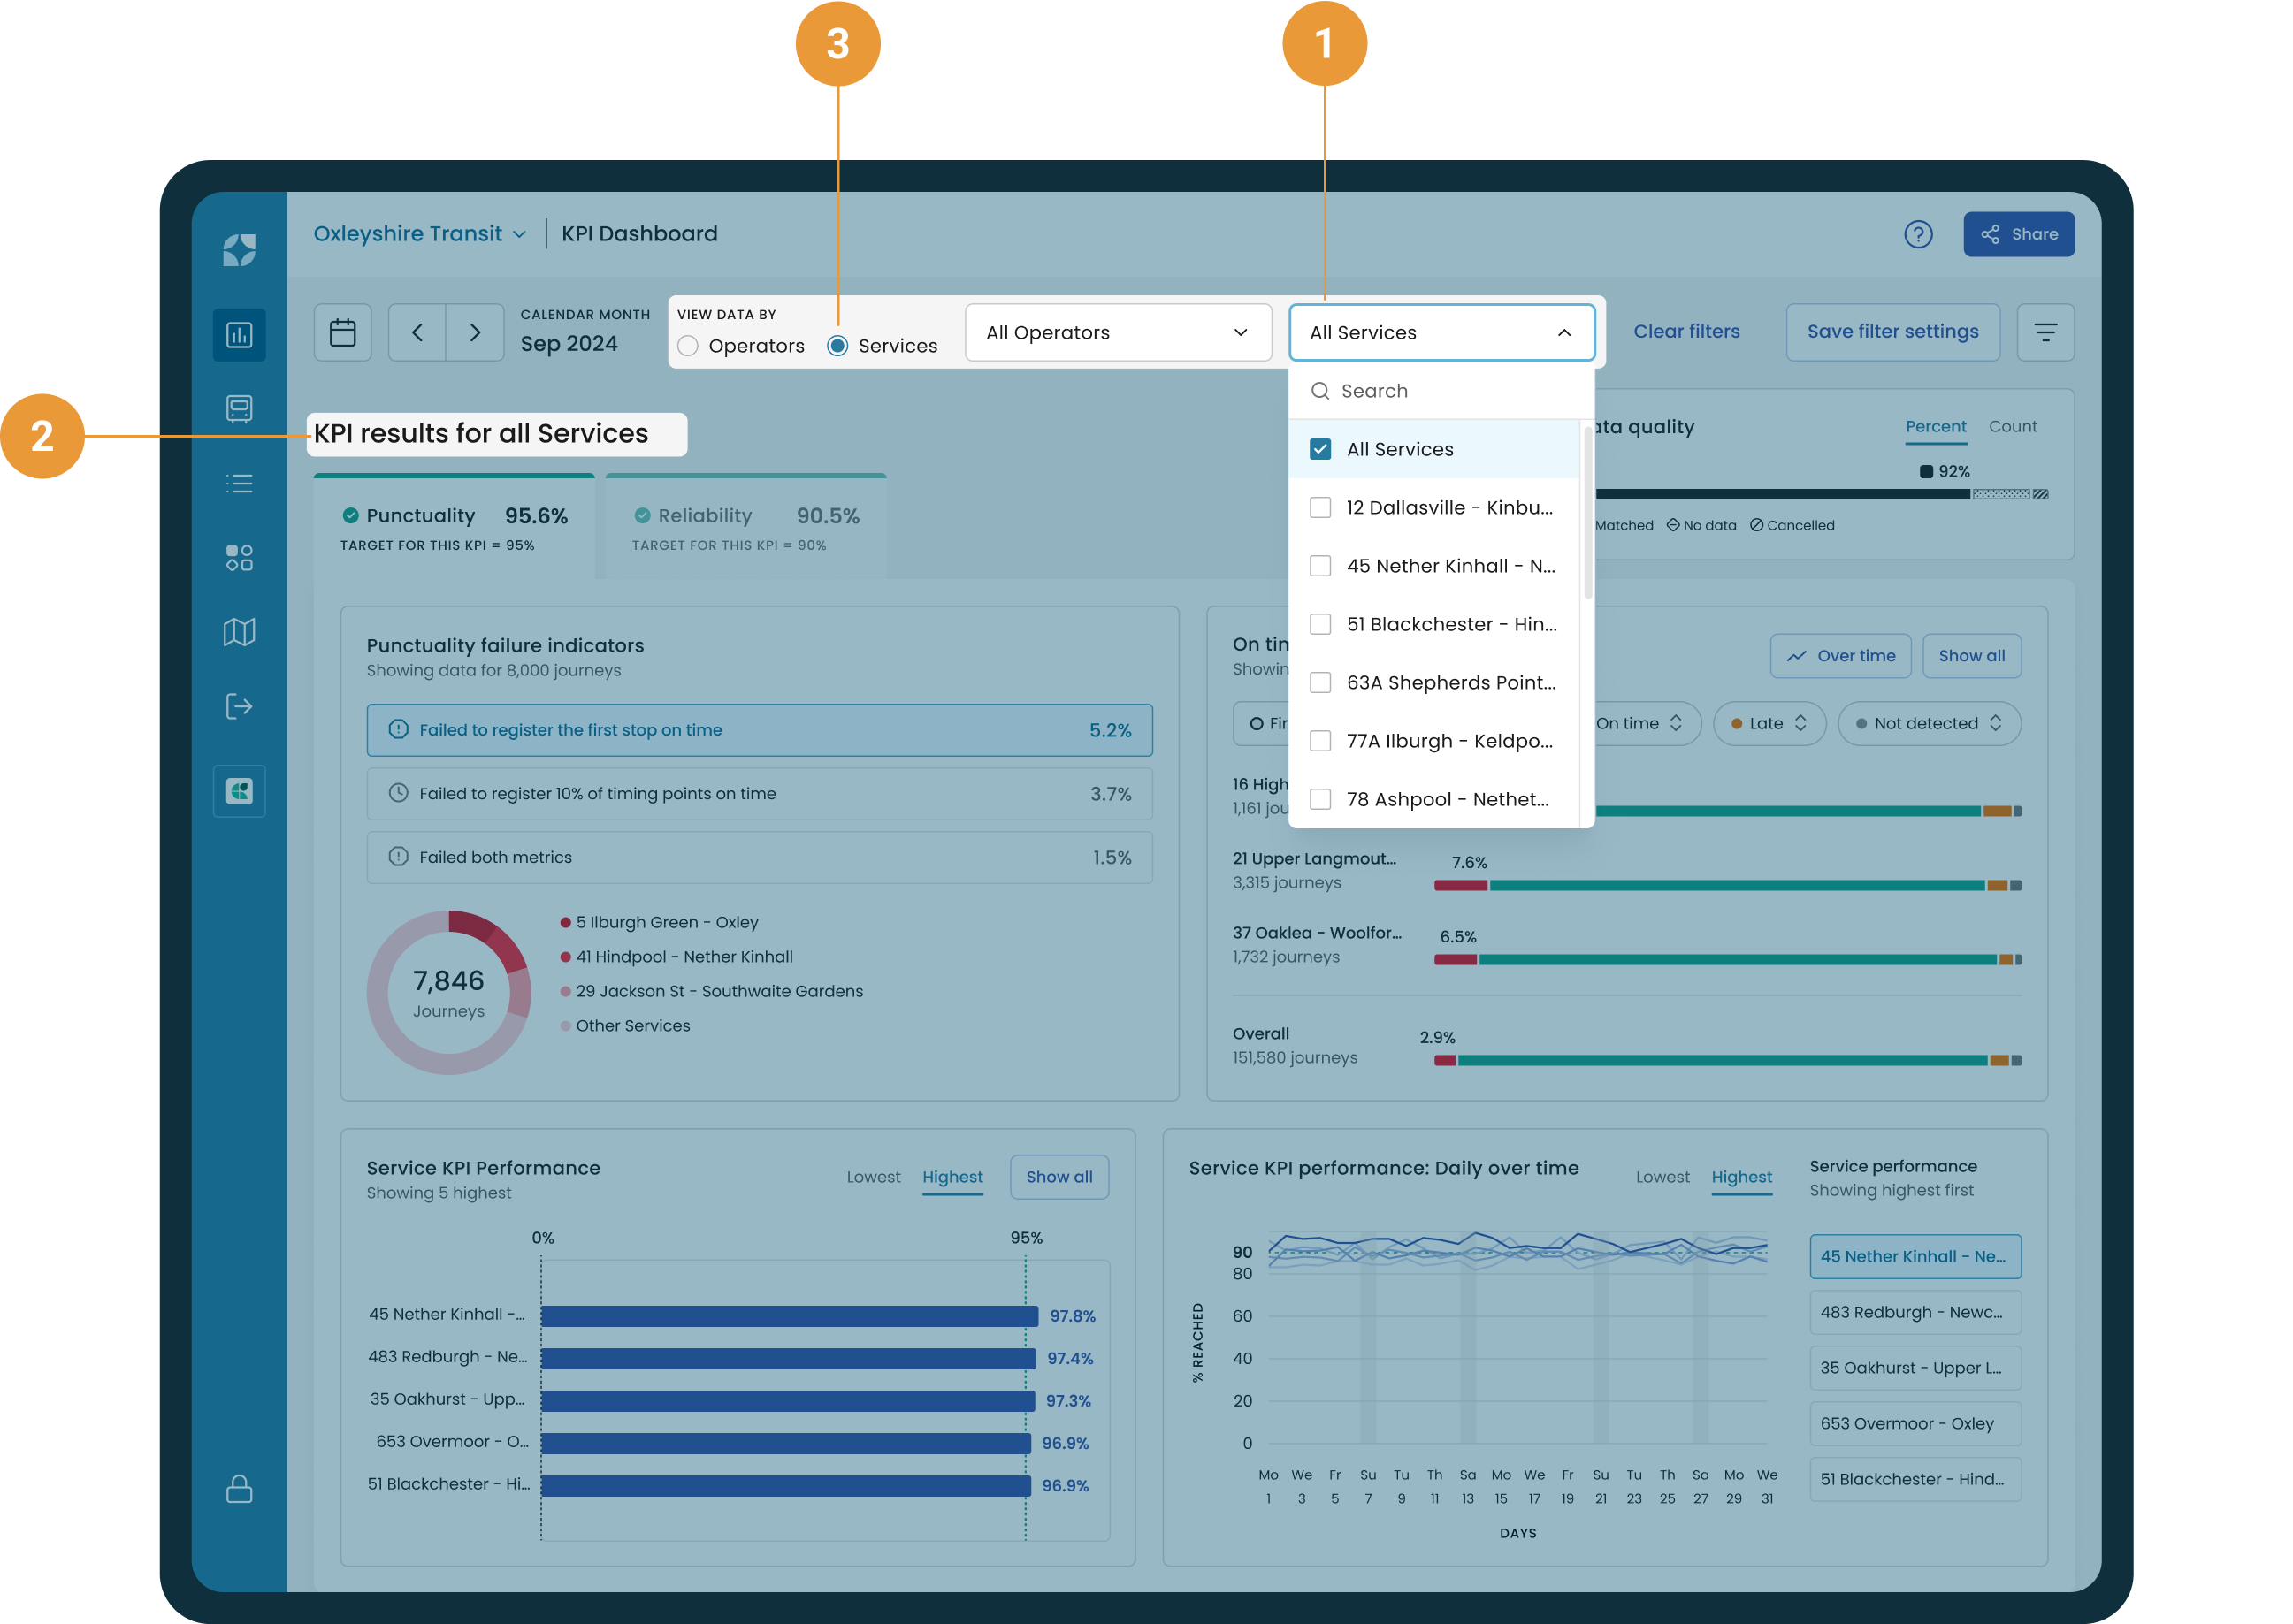
Dial in whichever services you want to view data for by selecting them from the second dropdown (1).
The selected service or number of services will be summarized in the KPI results header (2).
Toggle how you want to view the data you’ve selected on the dashboard – either by operators or services (3).