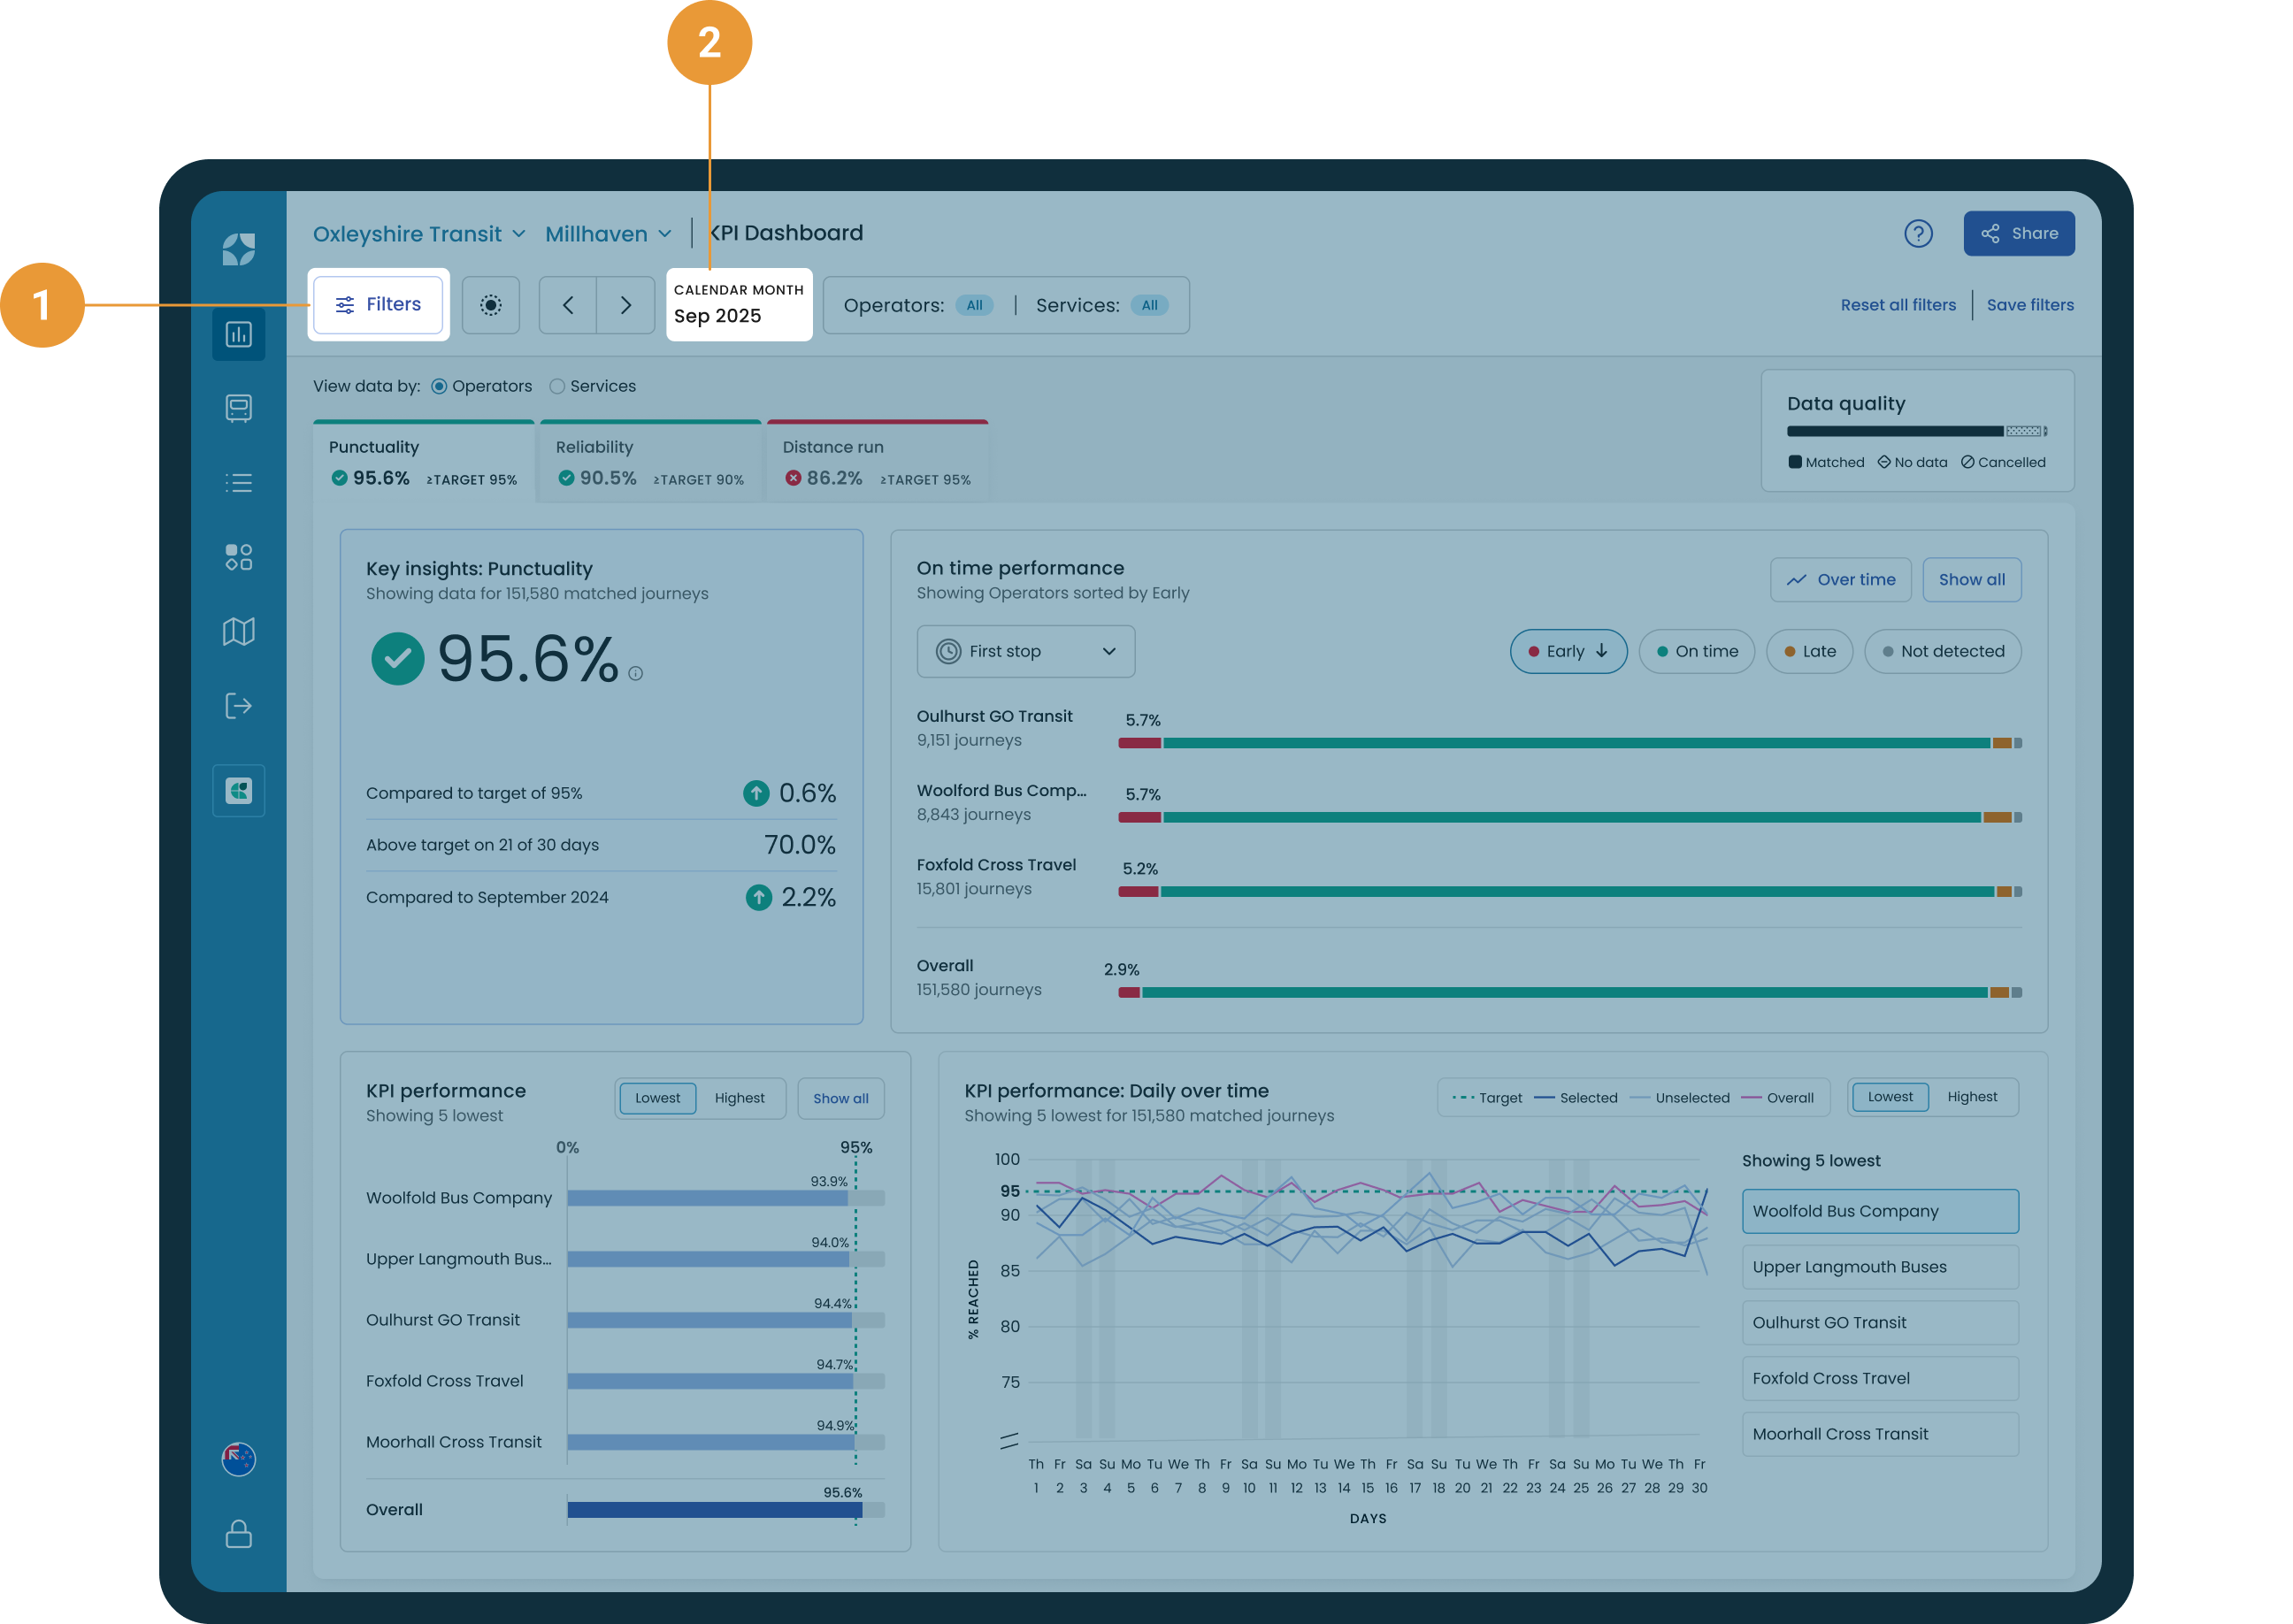
The date filter can be accessed from either the filter hub (1) or by clicking on date label (2). The date range you’ve selected stays persistent as you explore Mosaiq Insights.
Selecting a date range
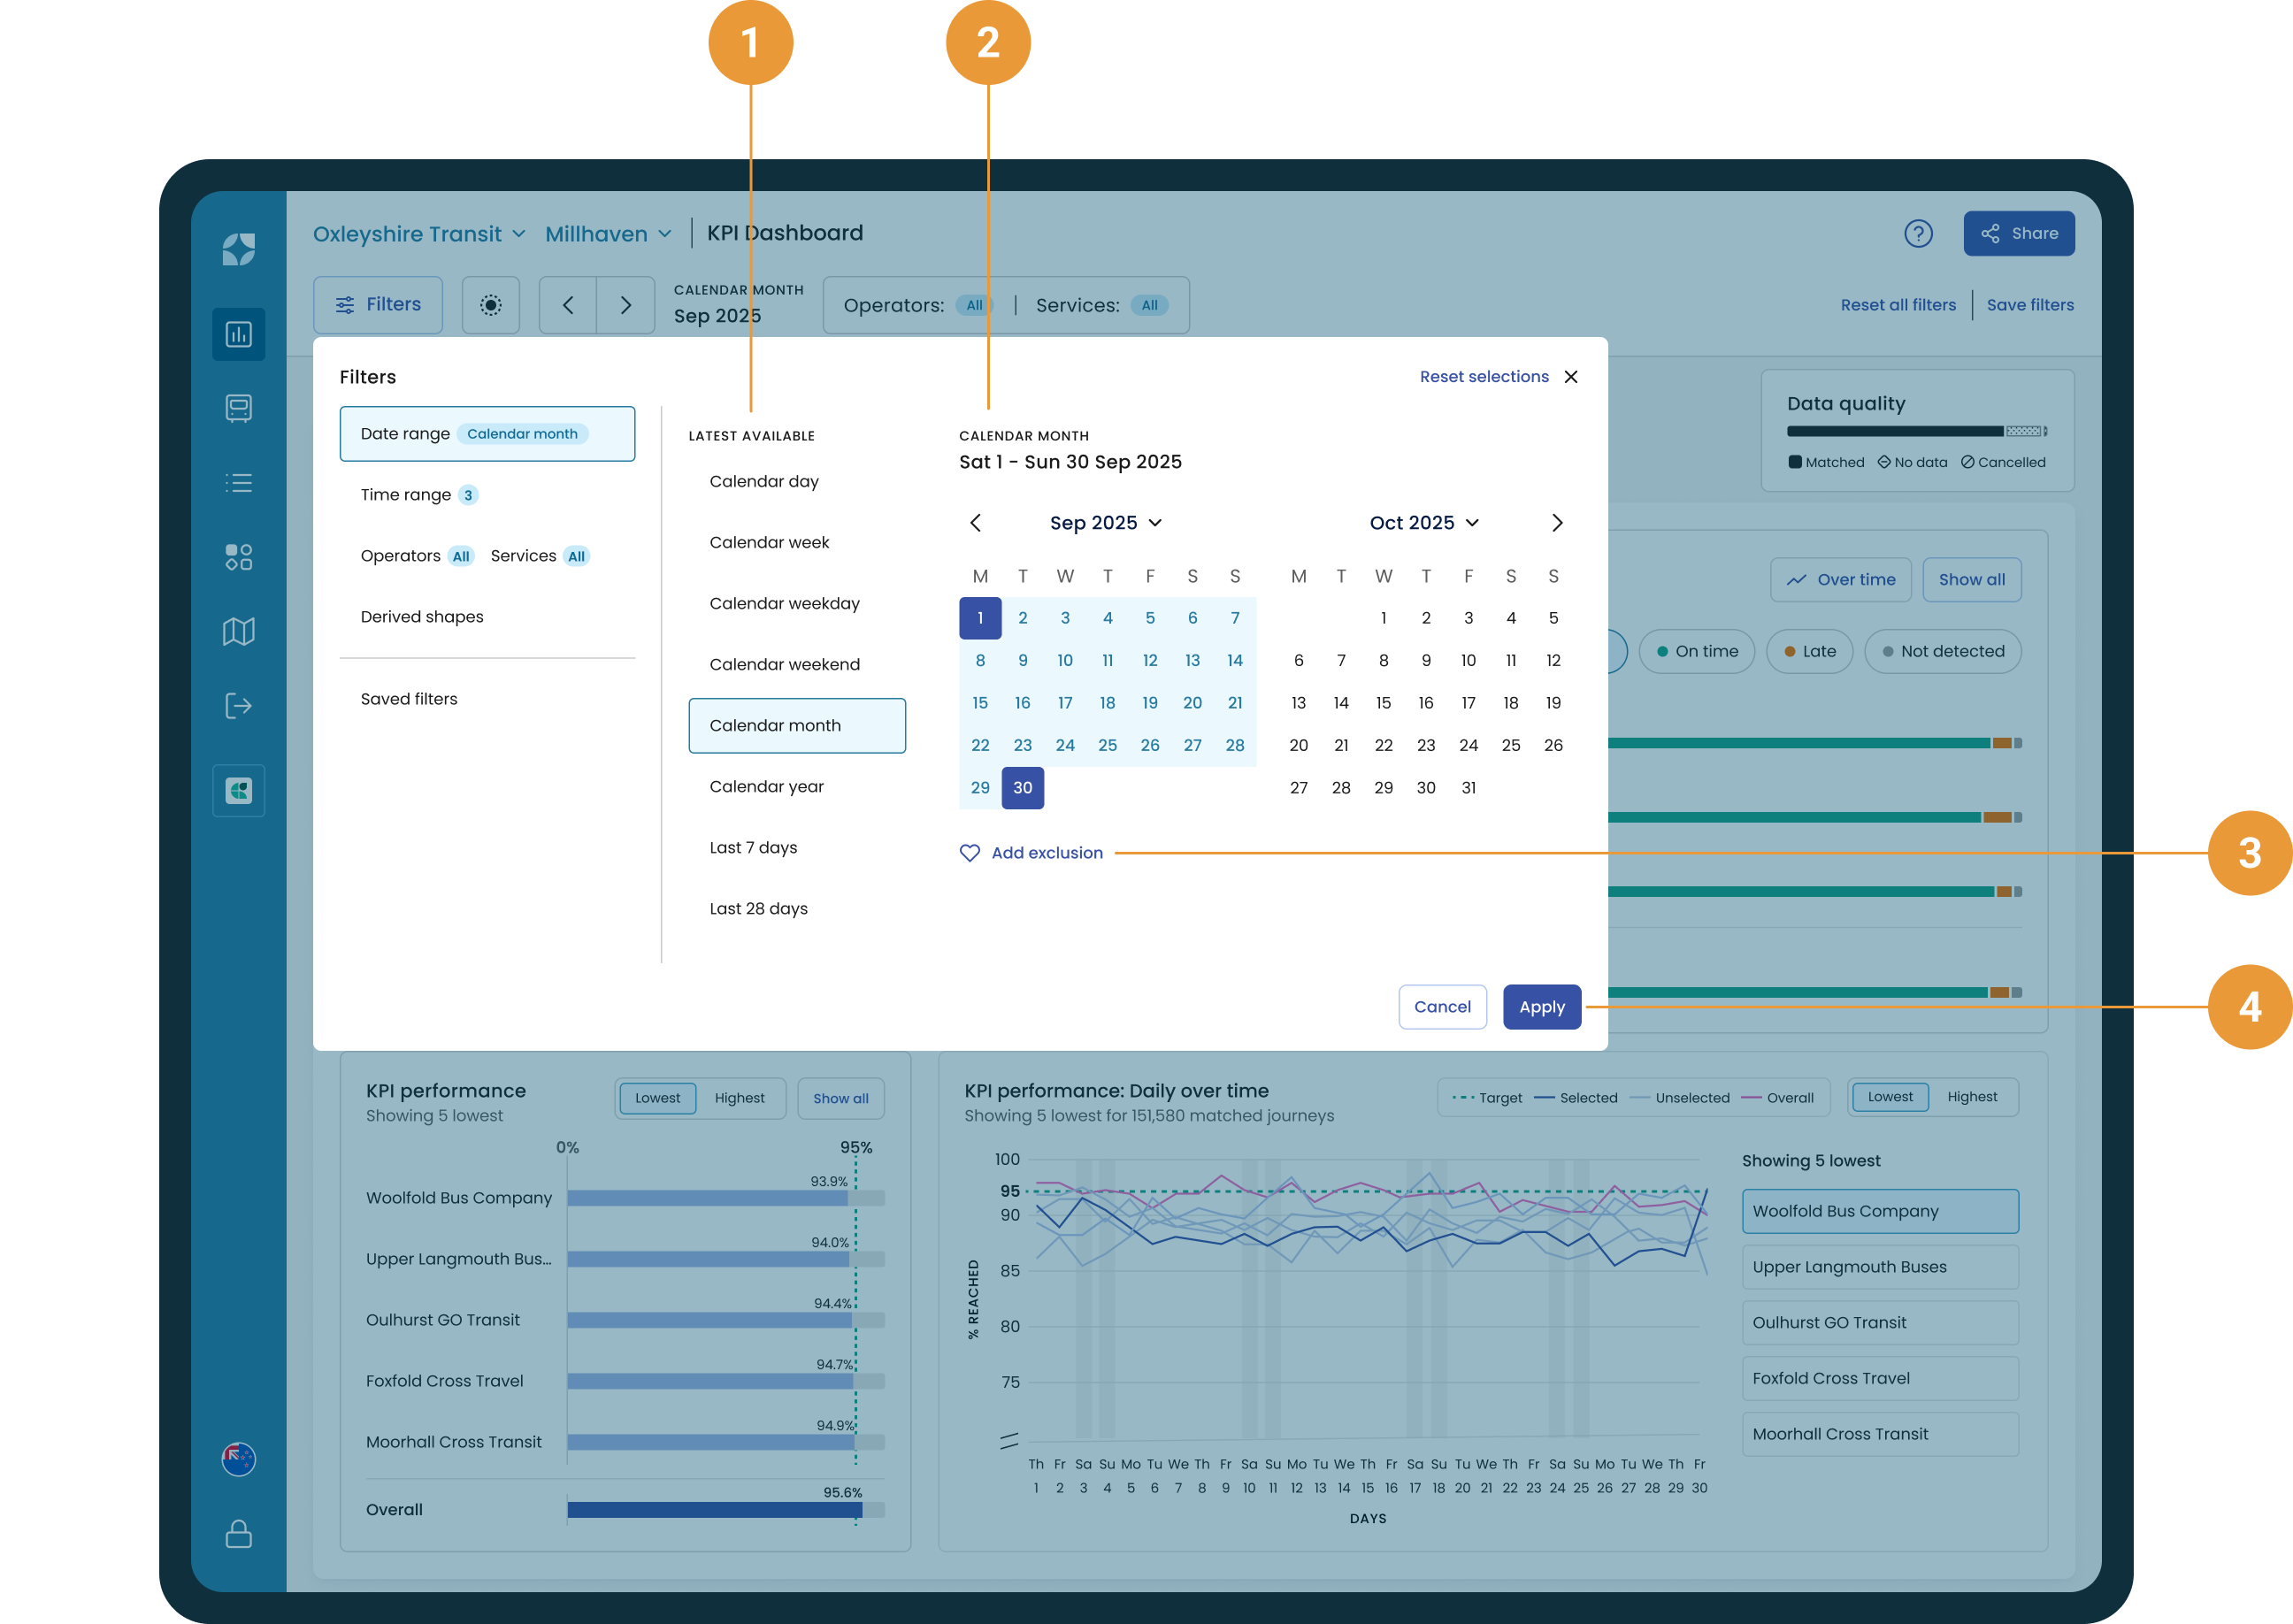
The calendar has some pre-set options to the left column of the window, or you can zero in on specific dates. The calendar defaults to showing the last 30 days of data.
To see a different range of historical data, either:
-
Select a different default date range from the pre-set options on the left (1). These defaults will always default to the latest available data.
-
Select a custom date range (2) by selecting a start and end date in the calendar picker.
-
Exclude certain days from your selected date range by clicking “+ Add exclusion” (3)
Click “Apply” to apply your date range or cancel (4) to return to the page without amending the date range. The “X” to the top right of the window will also cancel your selection.
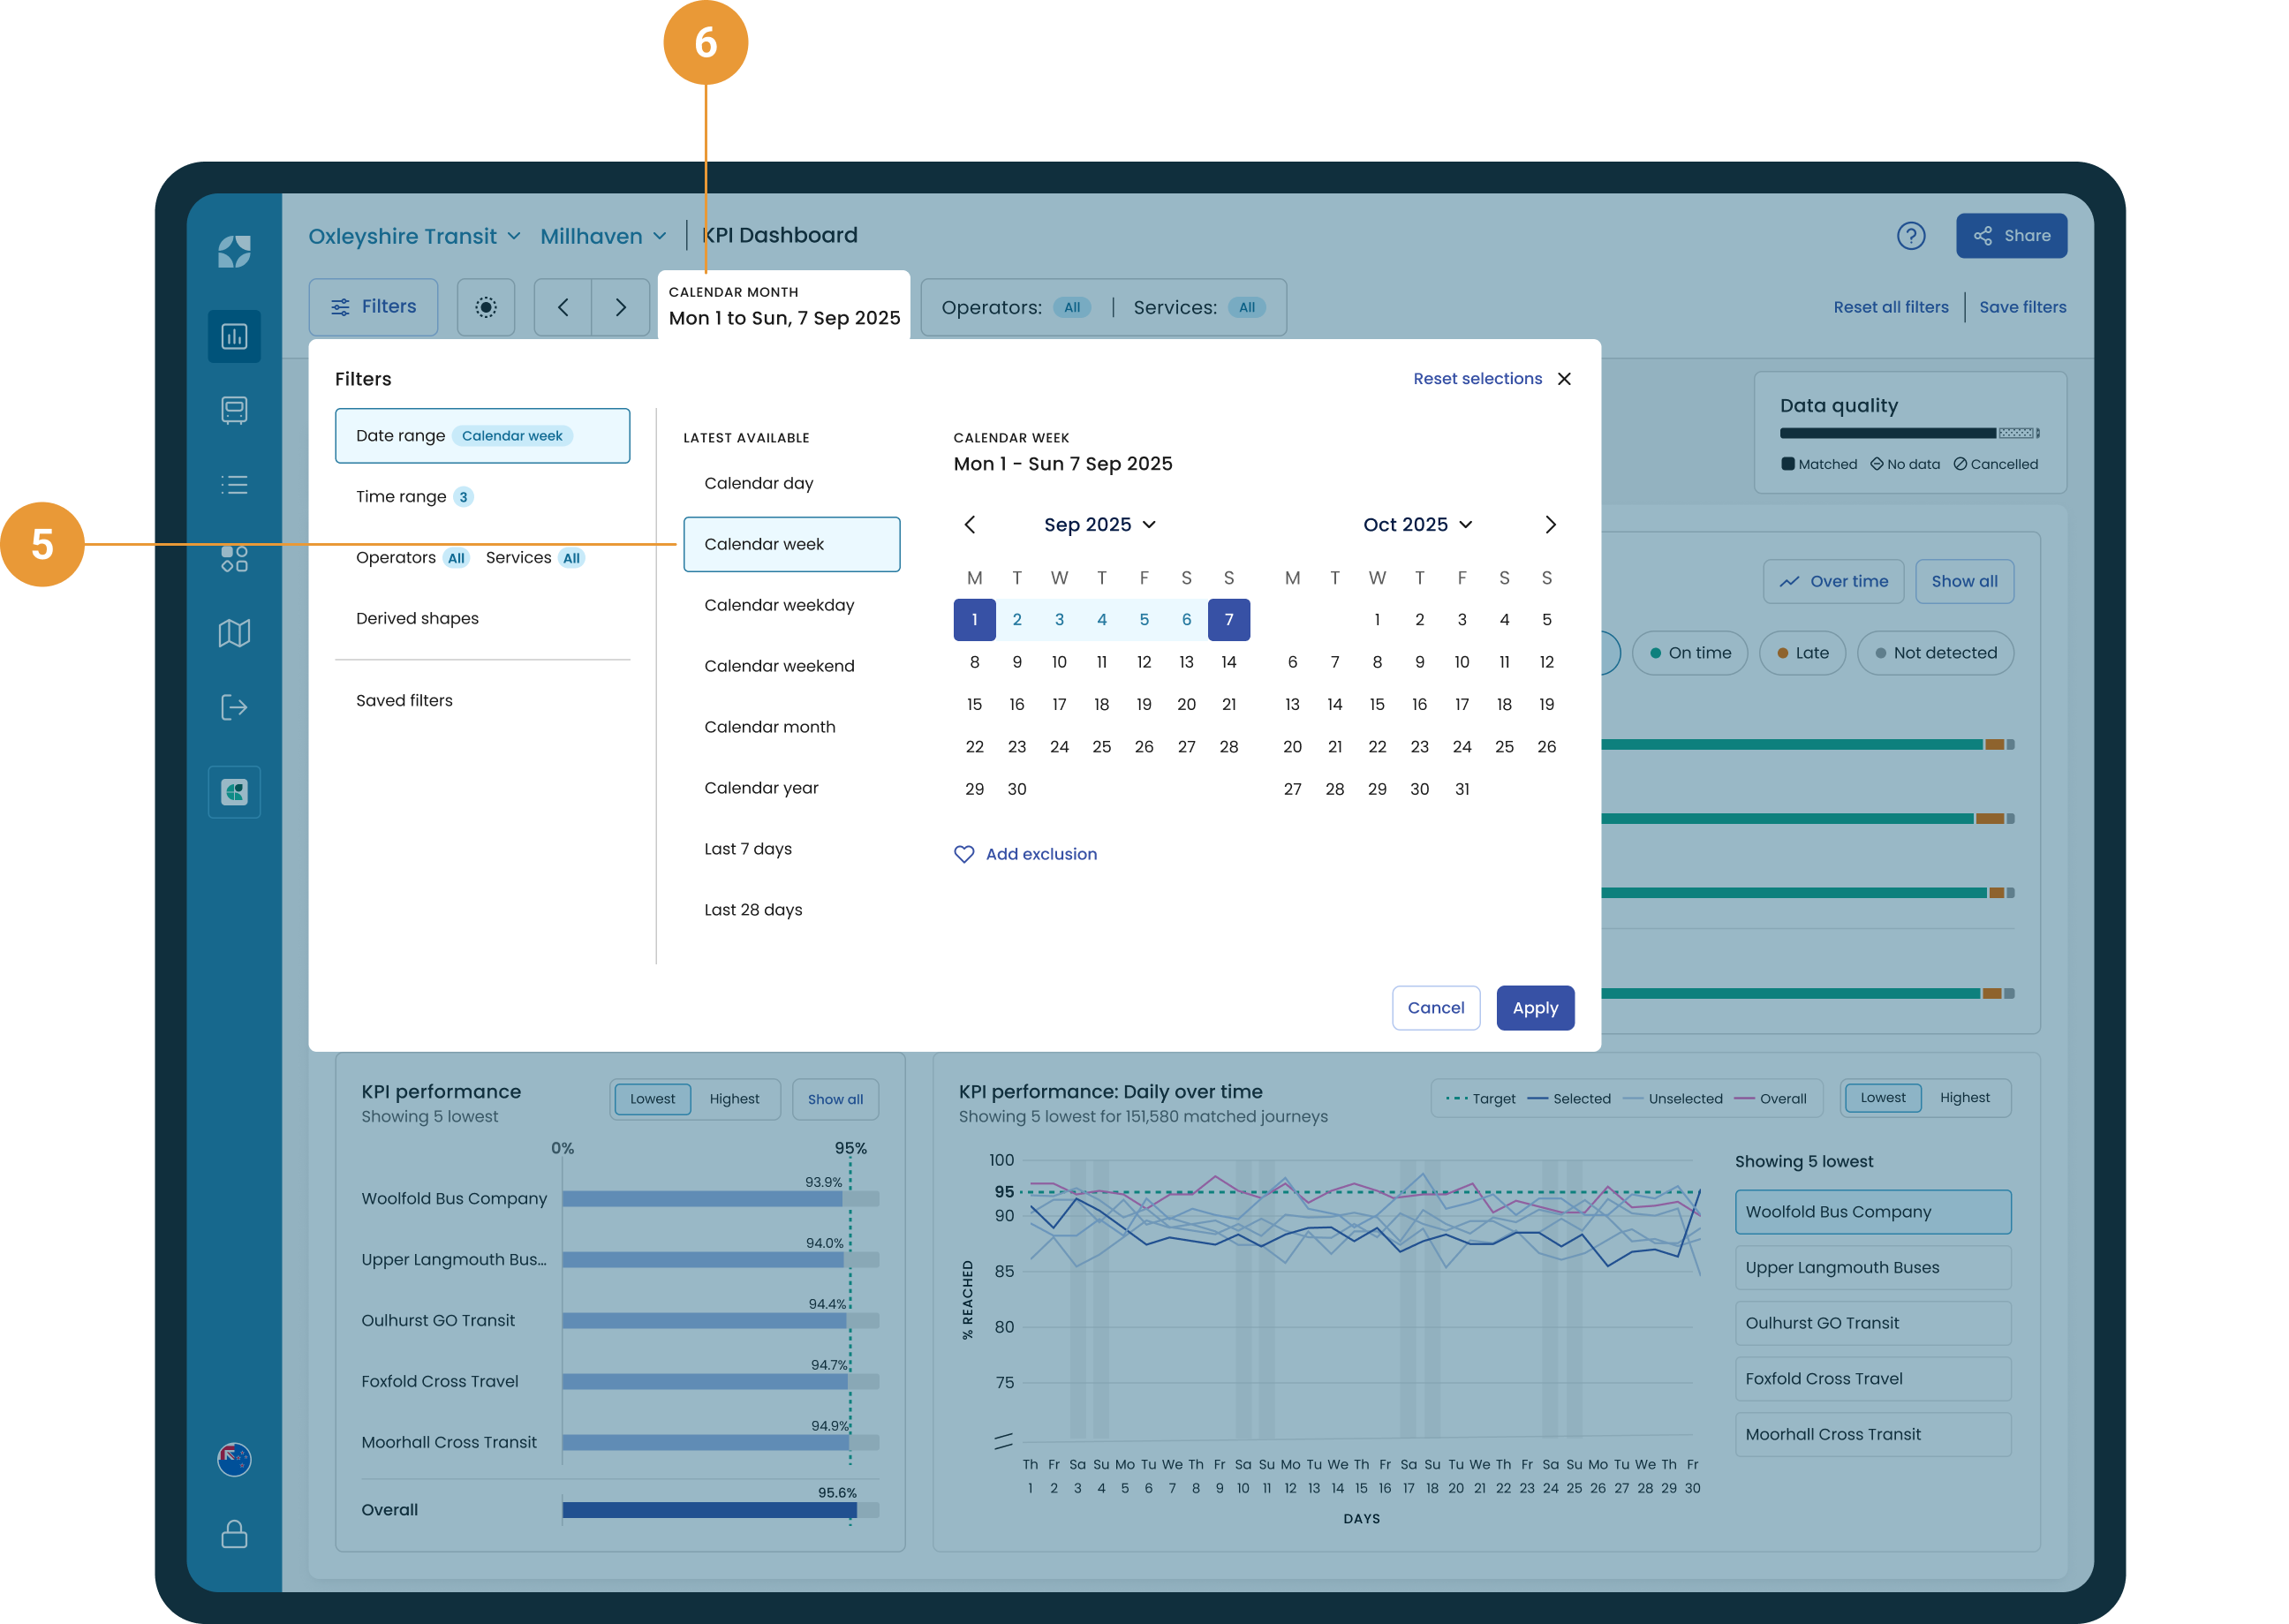
Once you’ve clicked “Apply” the performance data displayed throughout Mosaiq will update to reflect your selection. For instance, if in the calendar we change the pre-set date range from ”calendar month” data to “calendar week” (5), after we hit “Apply” the latest calendar week’s data will be displayed throughout Mosaiq.
The label will also update to indicate the date range that has been applied (6).
Adding exclusions
Some days are not like the others, for example unusual weather conditions, major events or school holidays could affect your insights reports. To help customise your insights to suit your needs exclusions can be added to your selected date range.
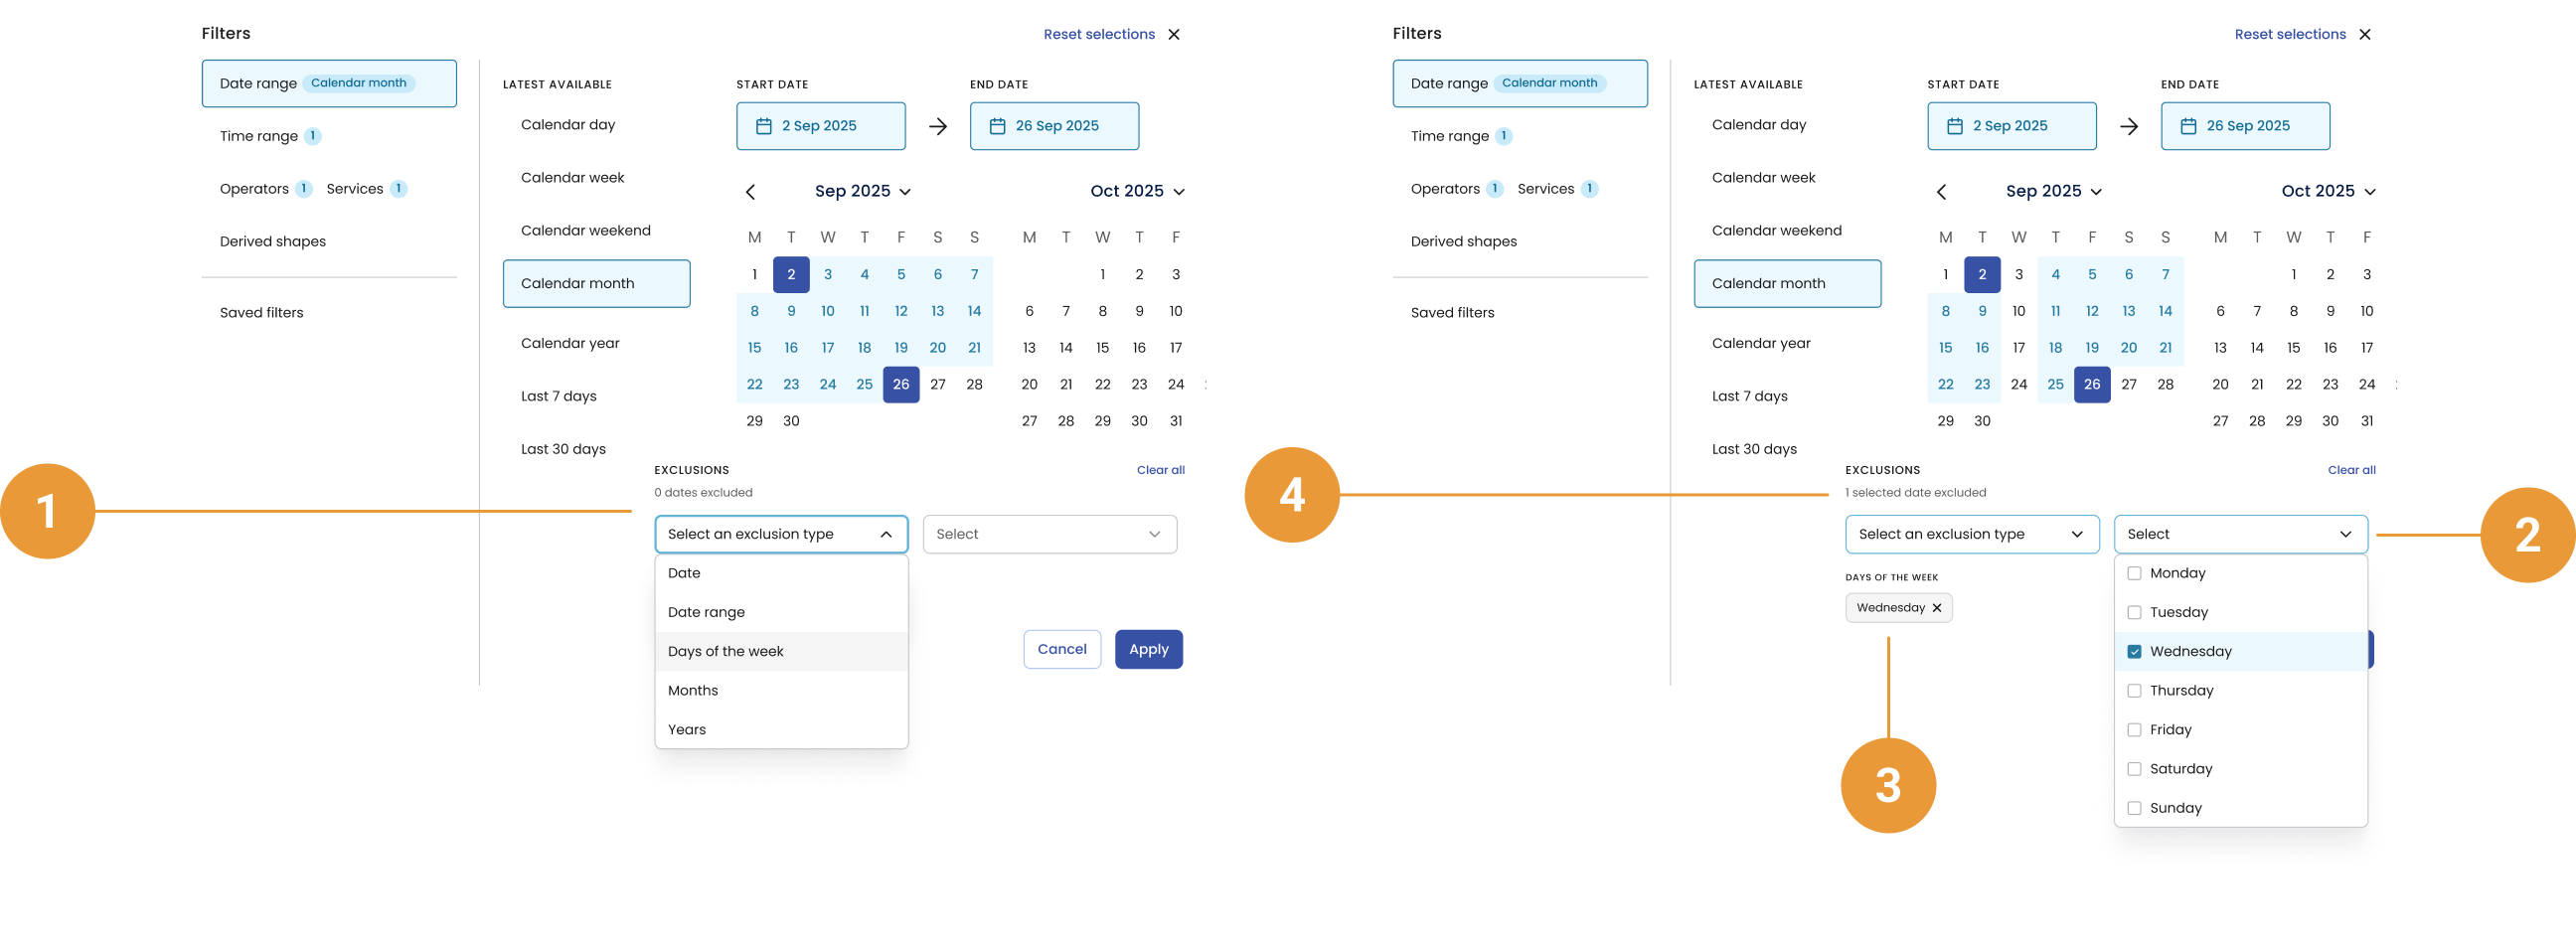
Once you have selected to “+ Add exclusion”:
-
Select the type of exclusion you wish to add (1). At the moment it is possible to exclude:
-
Date - An individual date or multiple individual dates, such as 01 Sep 2024 and 22 Sep 2024
-
Date range - Any number of date ranges, such as the 01 Sep 2024 to 05 Sep 2024 and 22 Sep 2024 and 24 Sep 2024
-
Days of the week - A specific day of the week, such as every Monday
-
Months - A specific month, such as January
-
Years - A specific year, such as 2023
-
-
Once you have selected your exclusion type, the second selection field will become active (2).
-
For every exclusion added a chip describing your exclusion will be shown (3) and the count of the number of dates excluded (4) will update.
-
Click “Apply” to apply your exclusion
You can add exclusions outside of your current selected date range. These exclusions will persist when toggling through date ranges.
When certain days are excluded, any data for those days will be omitted from Mosaiq. For example:
-
On the Running Times page, trips for excluded days will not appear in either the Table or Chart views.
-
On the On-Time Performance Over Time page, OTP metrics for excluded days will not be displayed.
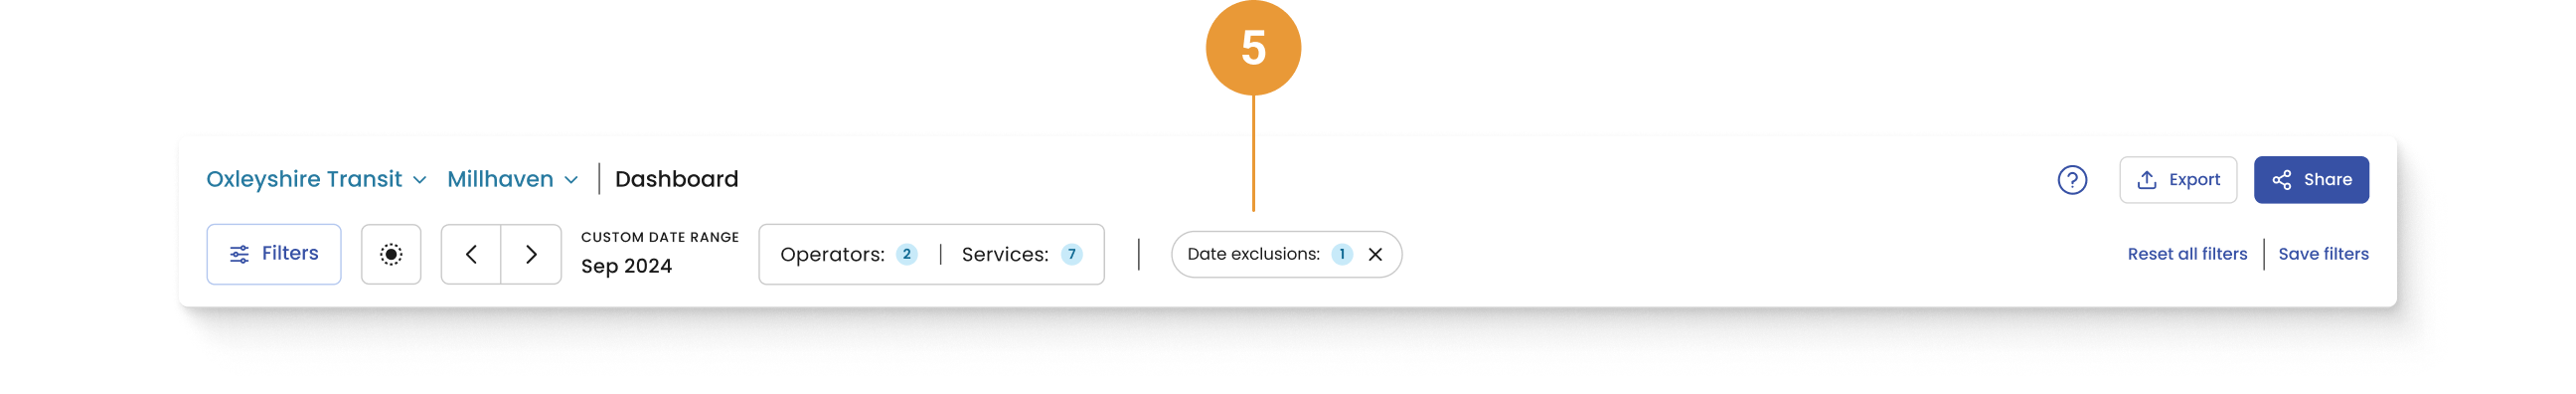
When exclusions have been applied, a chip will be shown in the filter panel (5). The chip will include a badge that provides an indication of the number of excluded dates that have been applied within your selected date range. For example, if a user excludes Mondays and the 1st of January 2026, and then:
-
Selects the month of January 2026, the badge would indicate that 5 date exclusions have been applied (4 Mondays and the 1st of January), or
-
Selects the month of February 2026, the badge would indicate that 4 date exclusions have been applied (4 Mondays)
The chip can be dismissed at any time by clicking the “x”.
Toggling through date ranges
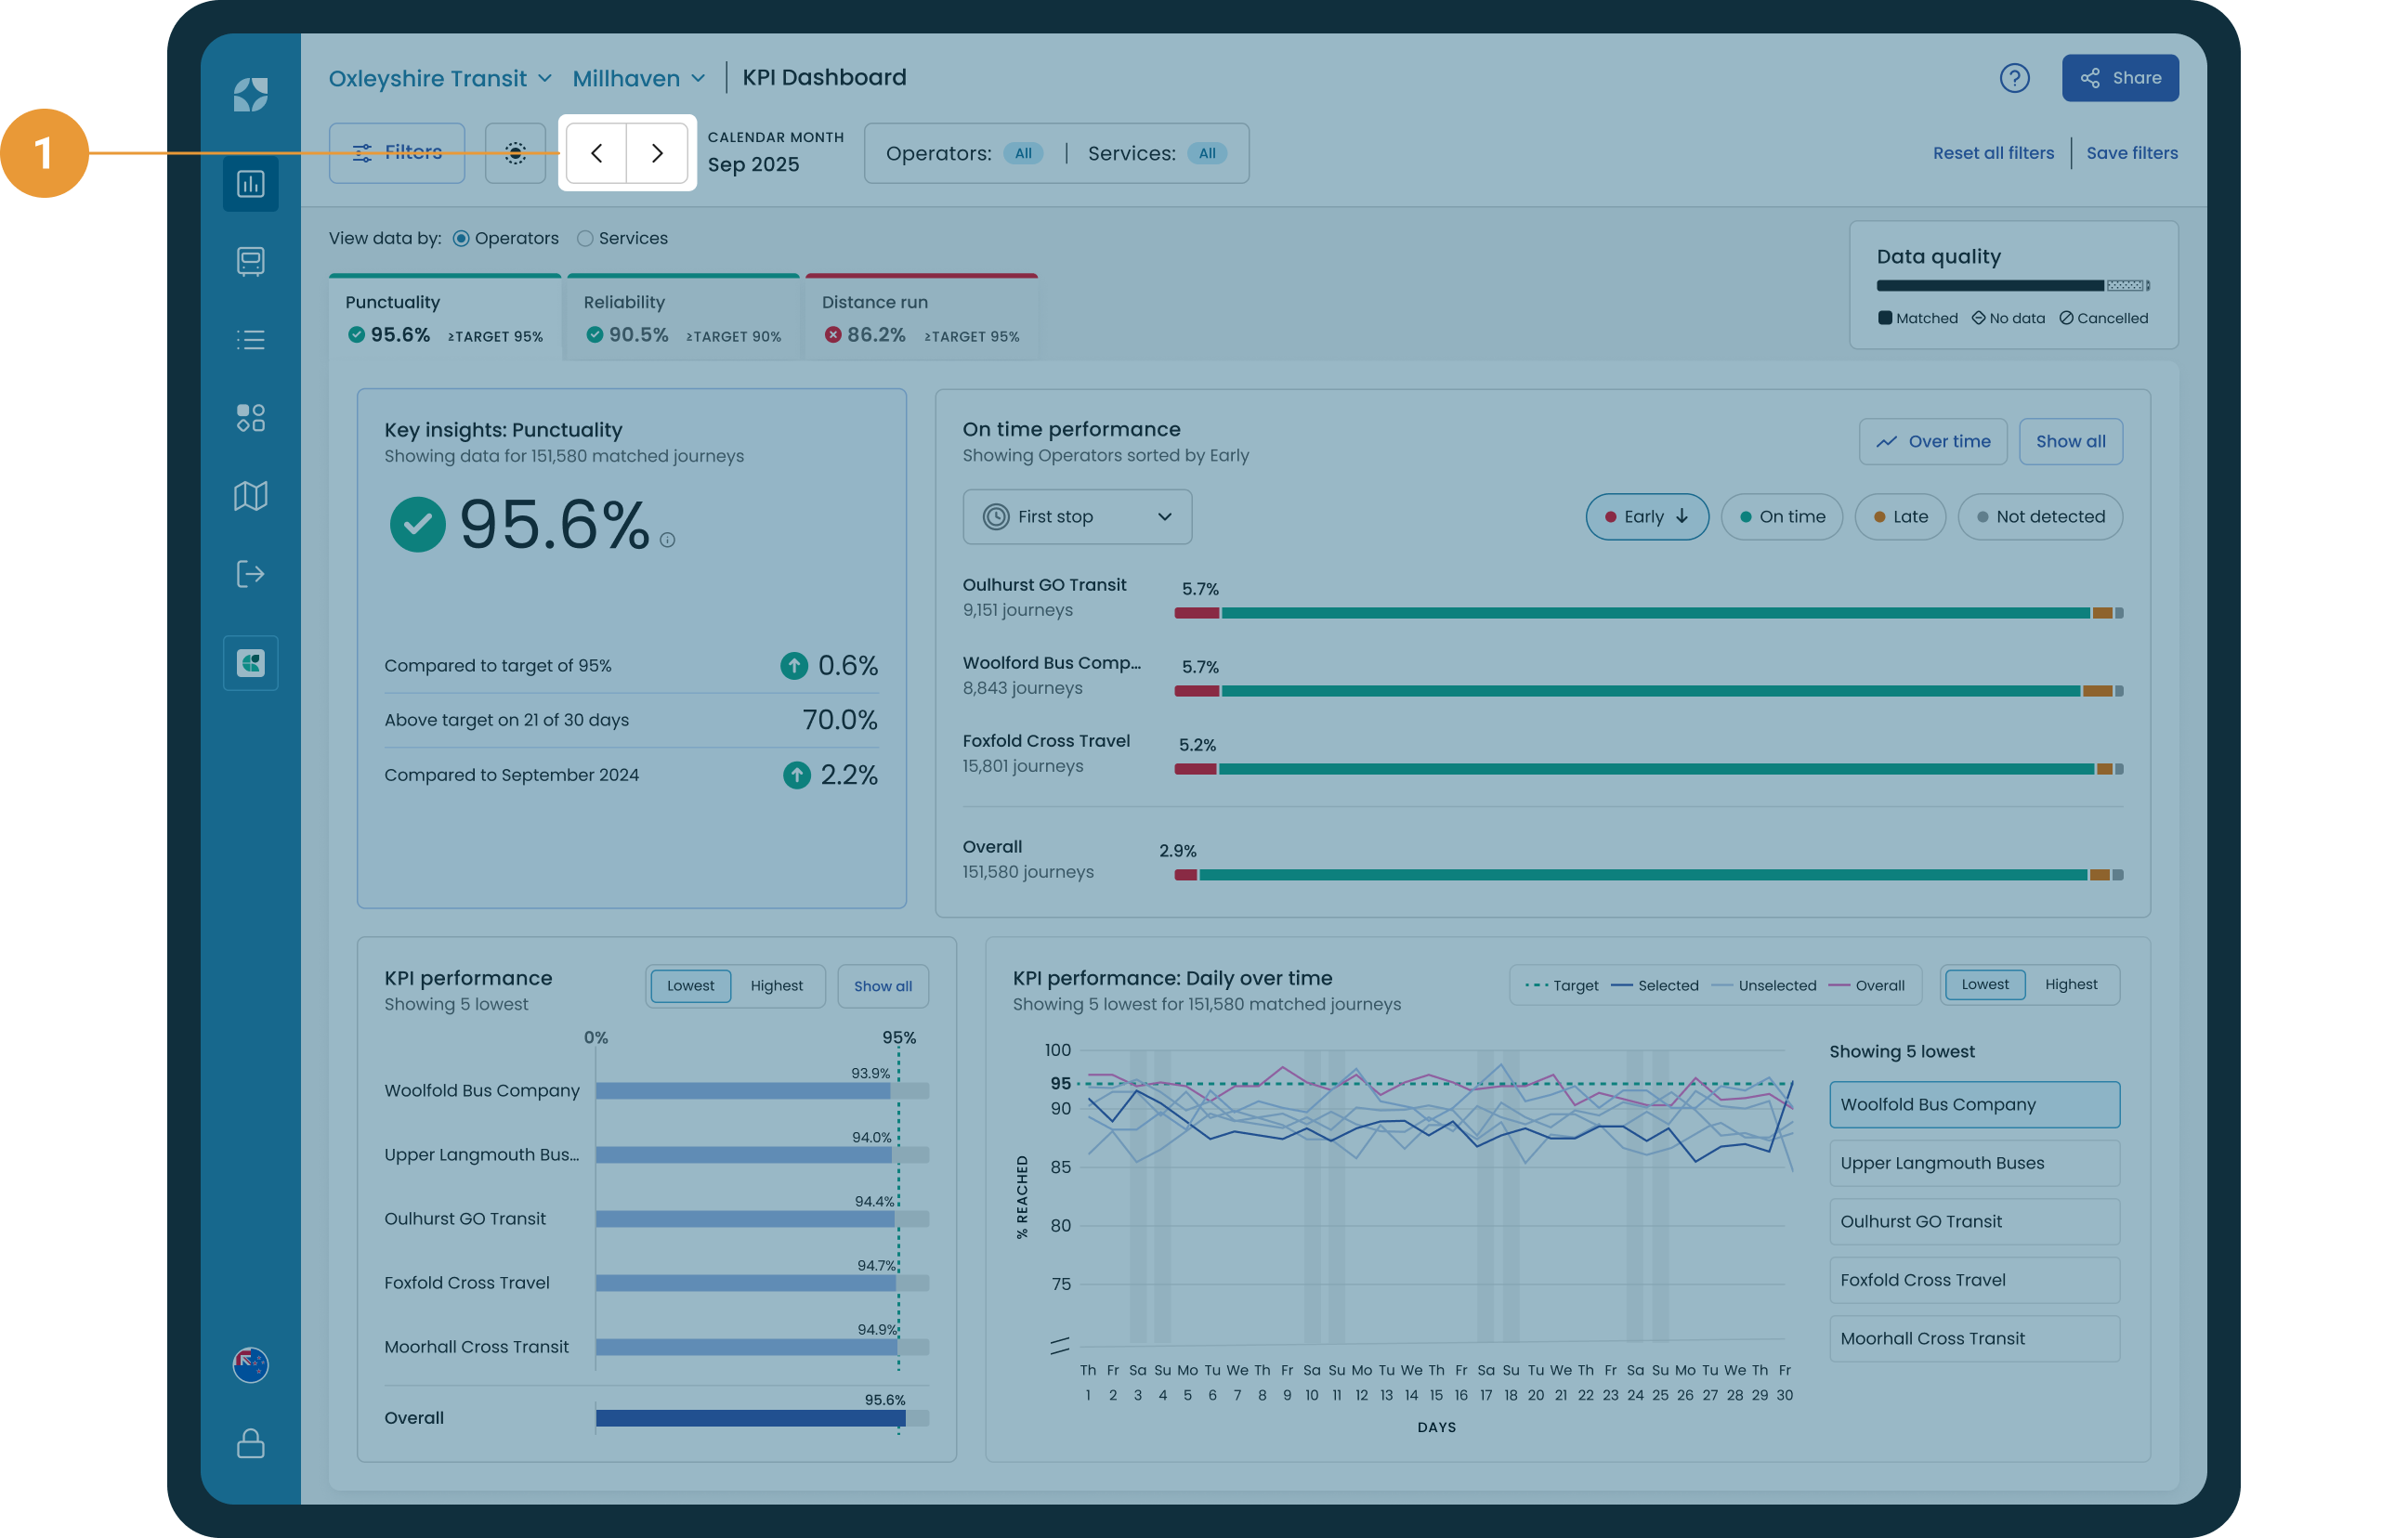
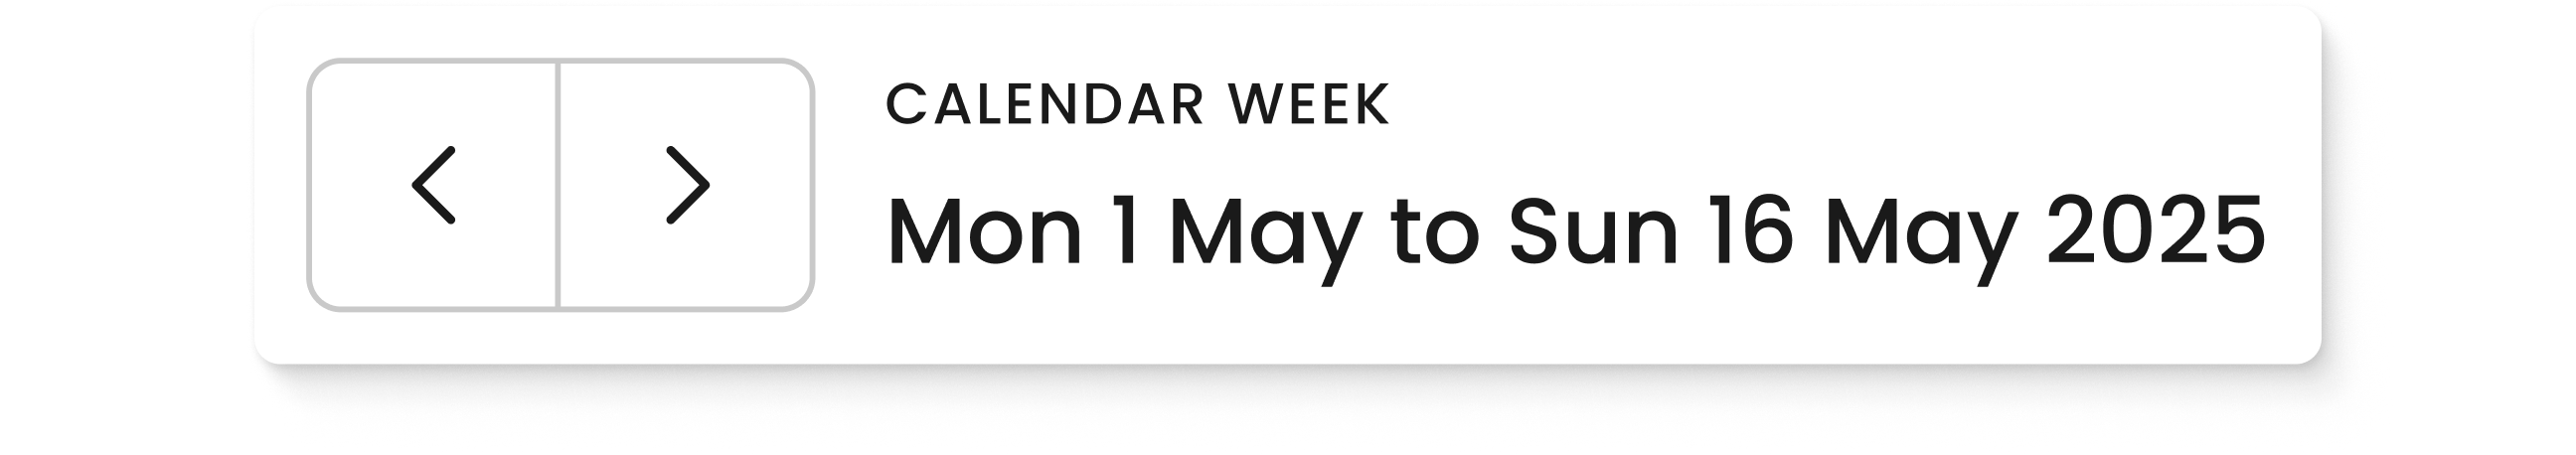
Click the left and right arrow buttons to toggle through performance data in your selected date range blocks (1). The left and right arrow buttons will shift the data shown in Mosaiq either backwards or forwards in time, respectively, by the same window of time selected. For example,
-
If performance data is being shown for the calendar month of “May 2025”. All data shown on the KPI Dashboard will be from 01 to 31 May. Using the left and right arrow buttons will shift the performance data shown in the charts backwards and forwards in time by one calendar month.

-
If performance data is being shown for a custom date range of 01 to 16 May 2025. All data shown on the KPI Dashboard will be from 01 to 16 May 2025. Using the left and right arrow buttons will shift the performance data shown in the charts backwards and forwards in time by the same sized time block: tabbing forwards in time would show 17 May to 01 June 2025, backwards would show 15 to 30 April 2025.