
Mosaiq users can access a summary view of an operator’s performance, covering data quality - including full and partial cancellations.
This summary also includes metrics for on-time performance at the first stop, last stop and interim timing points – represented as both an aggregate figure for a period, or graphically over time, as well as operator distance performance metrics. It provides valuable insights into performance trends, enabling more informed operational adjustments.
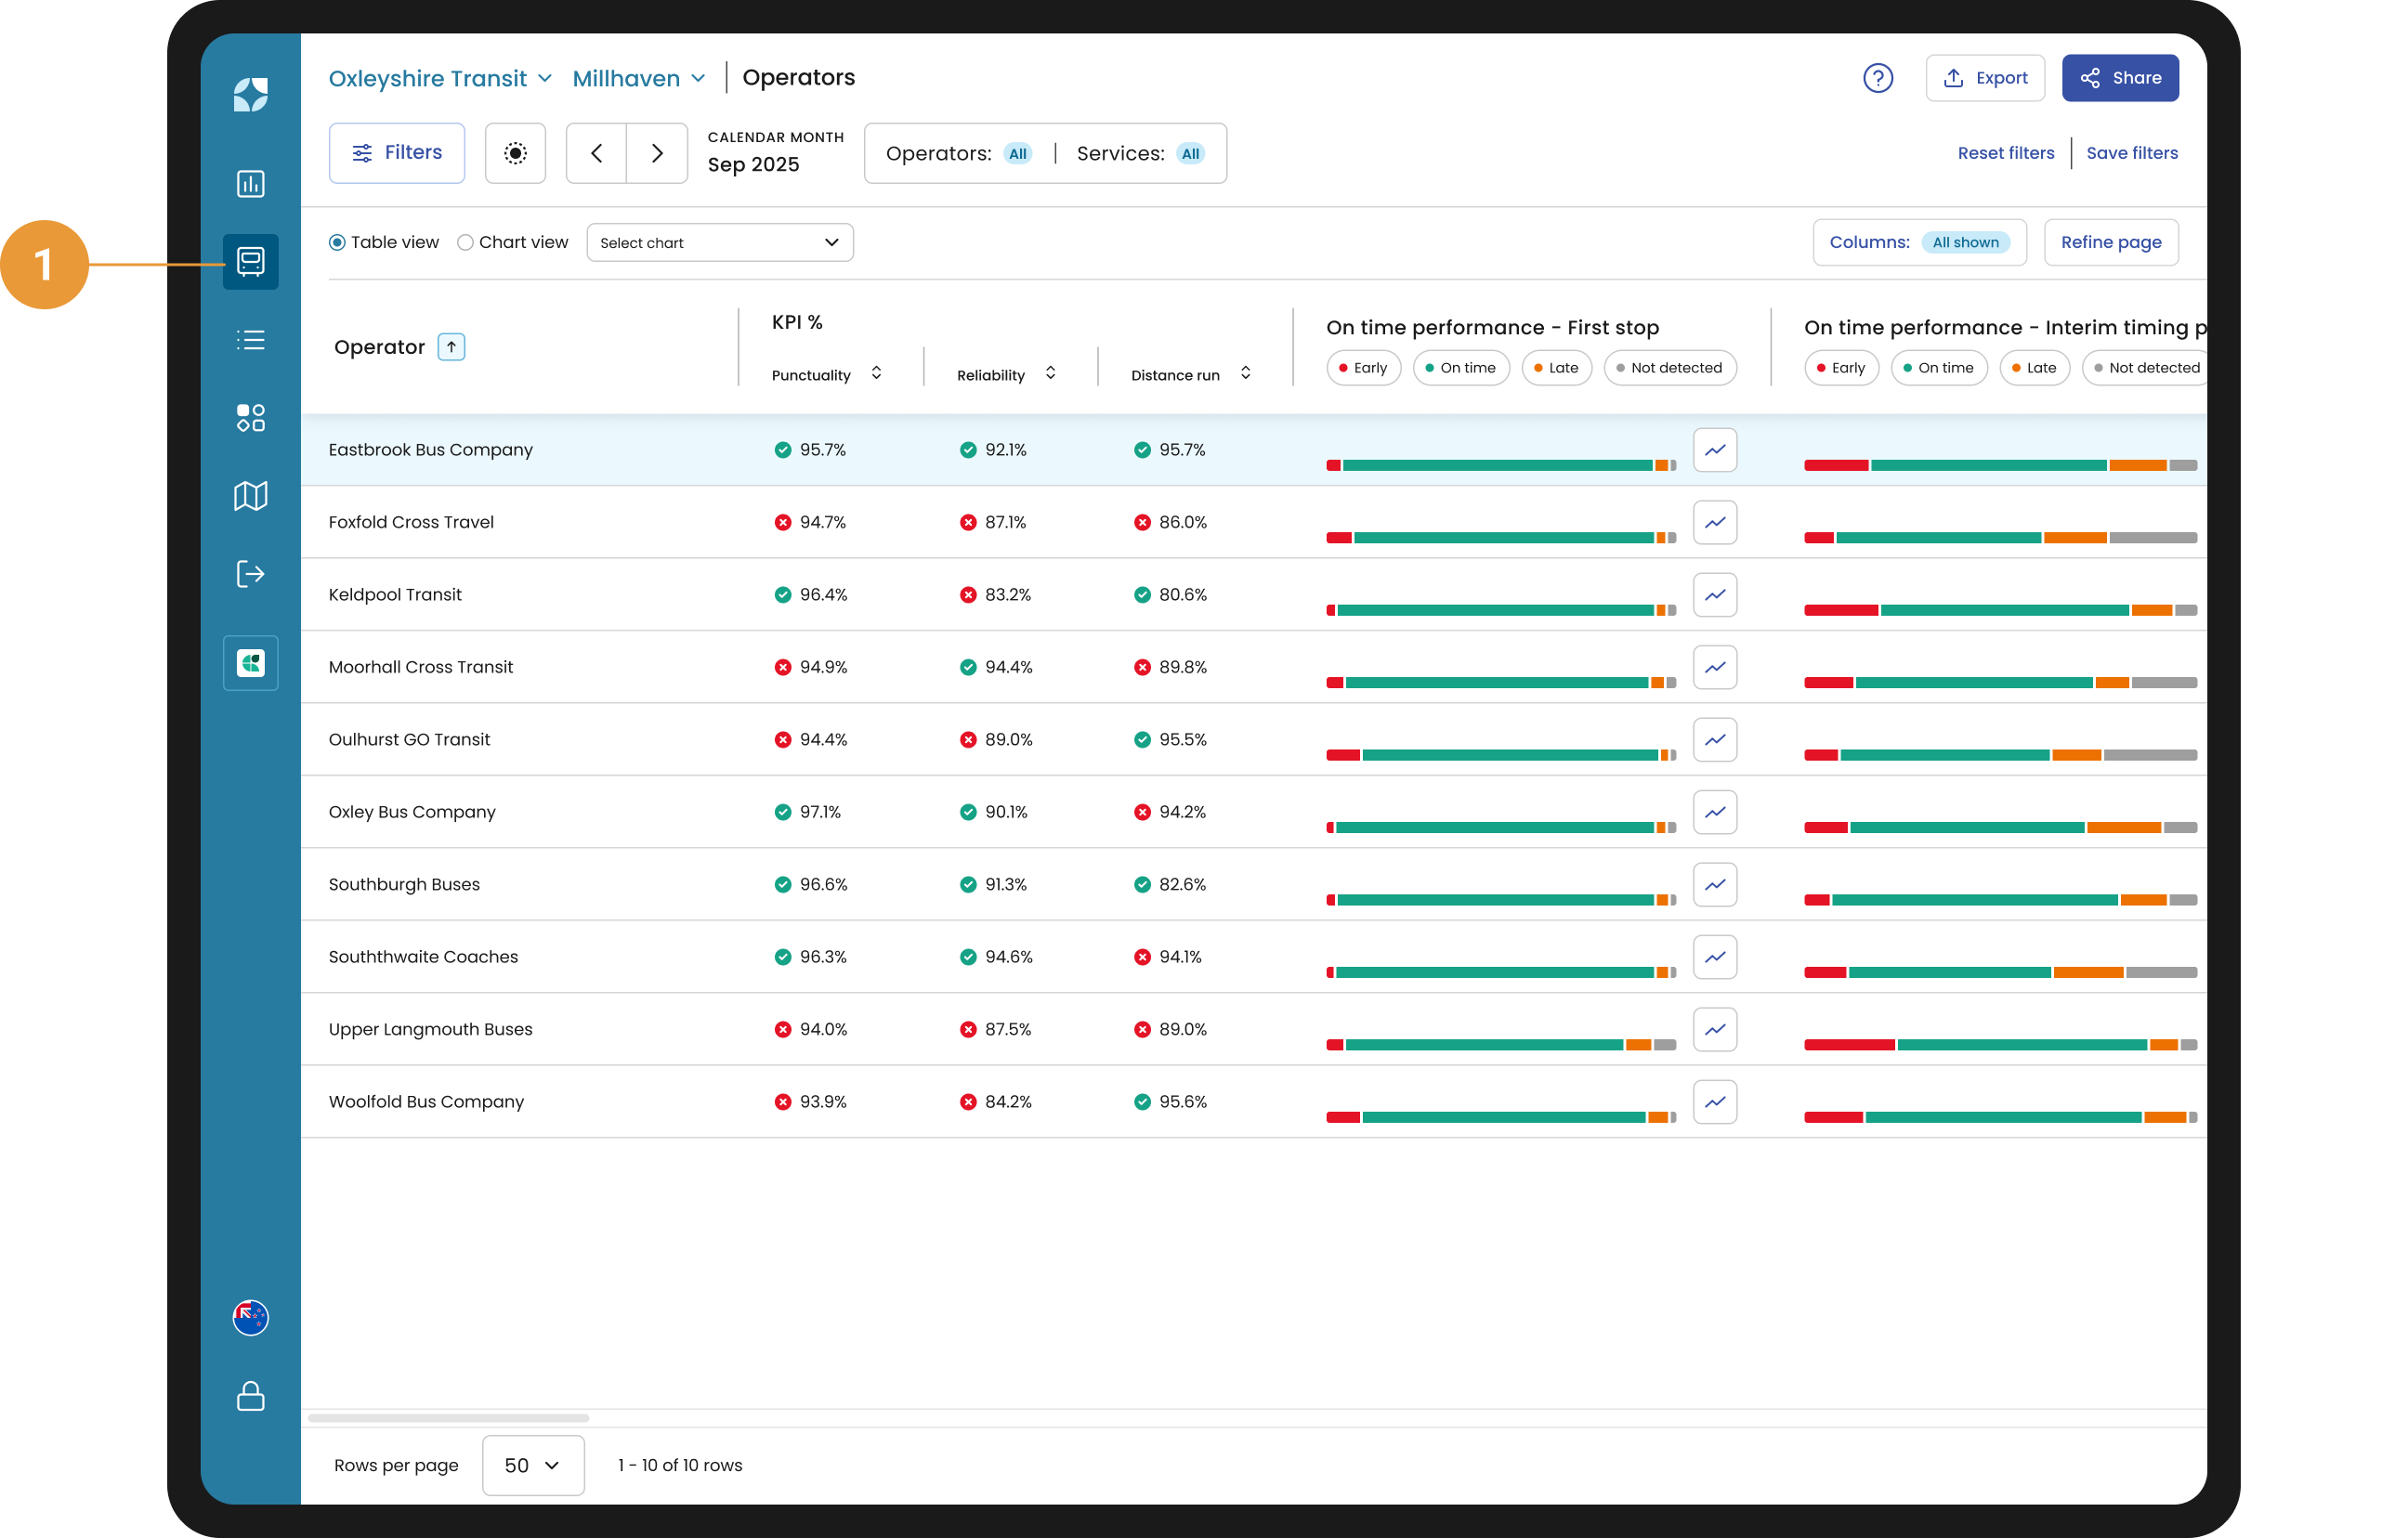
To see a list view of your operators, click Operators in the left navigation (1).
Click on any operator to quickly navigate to the services screen for that operator.
Viewing and analysing operator performance
-
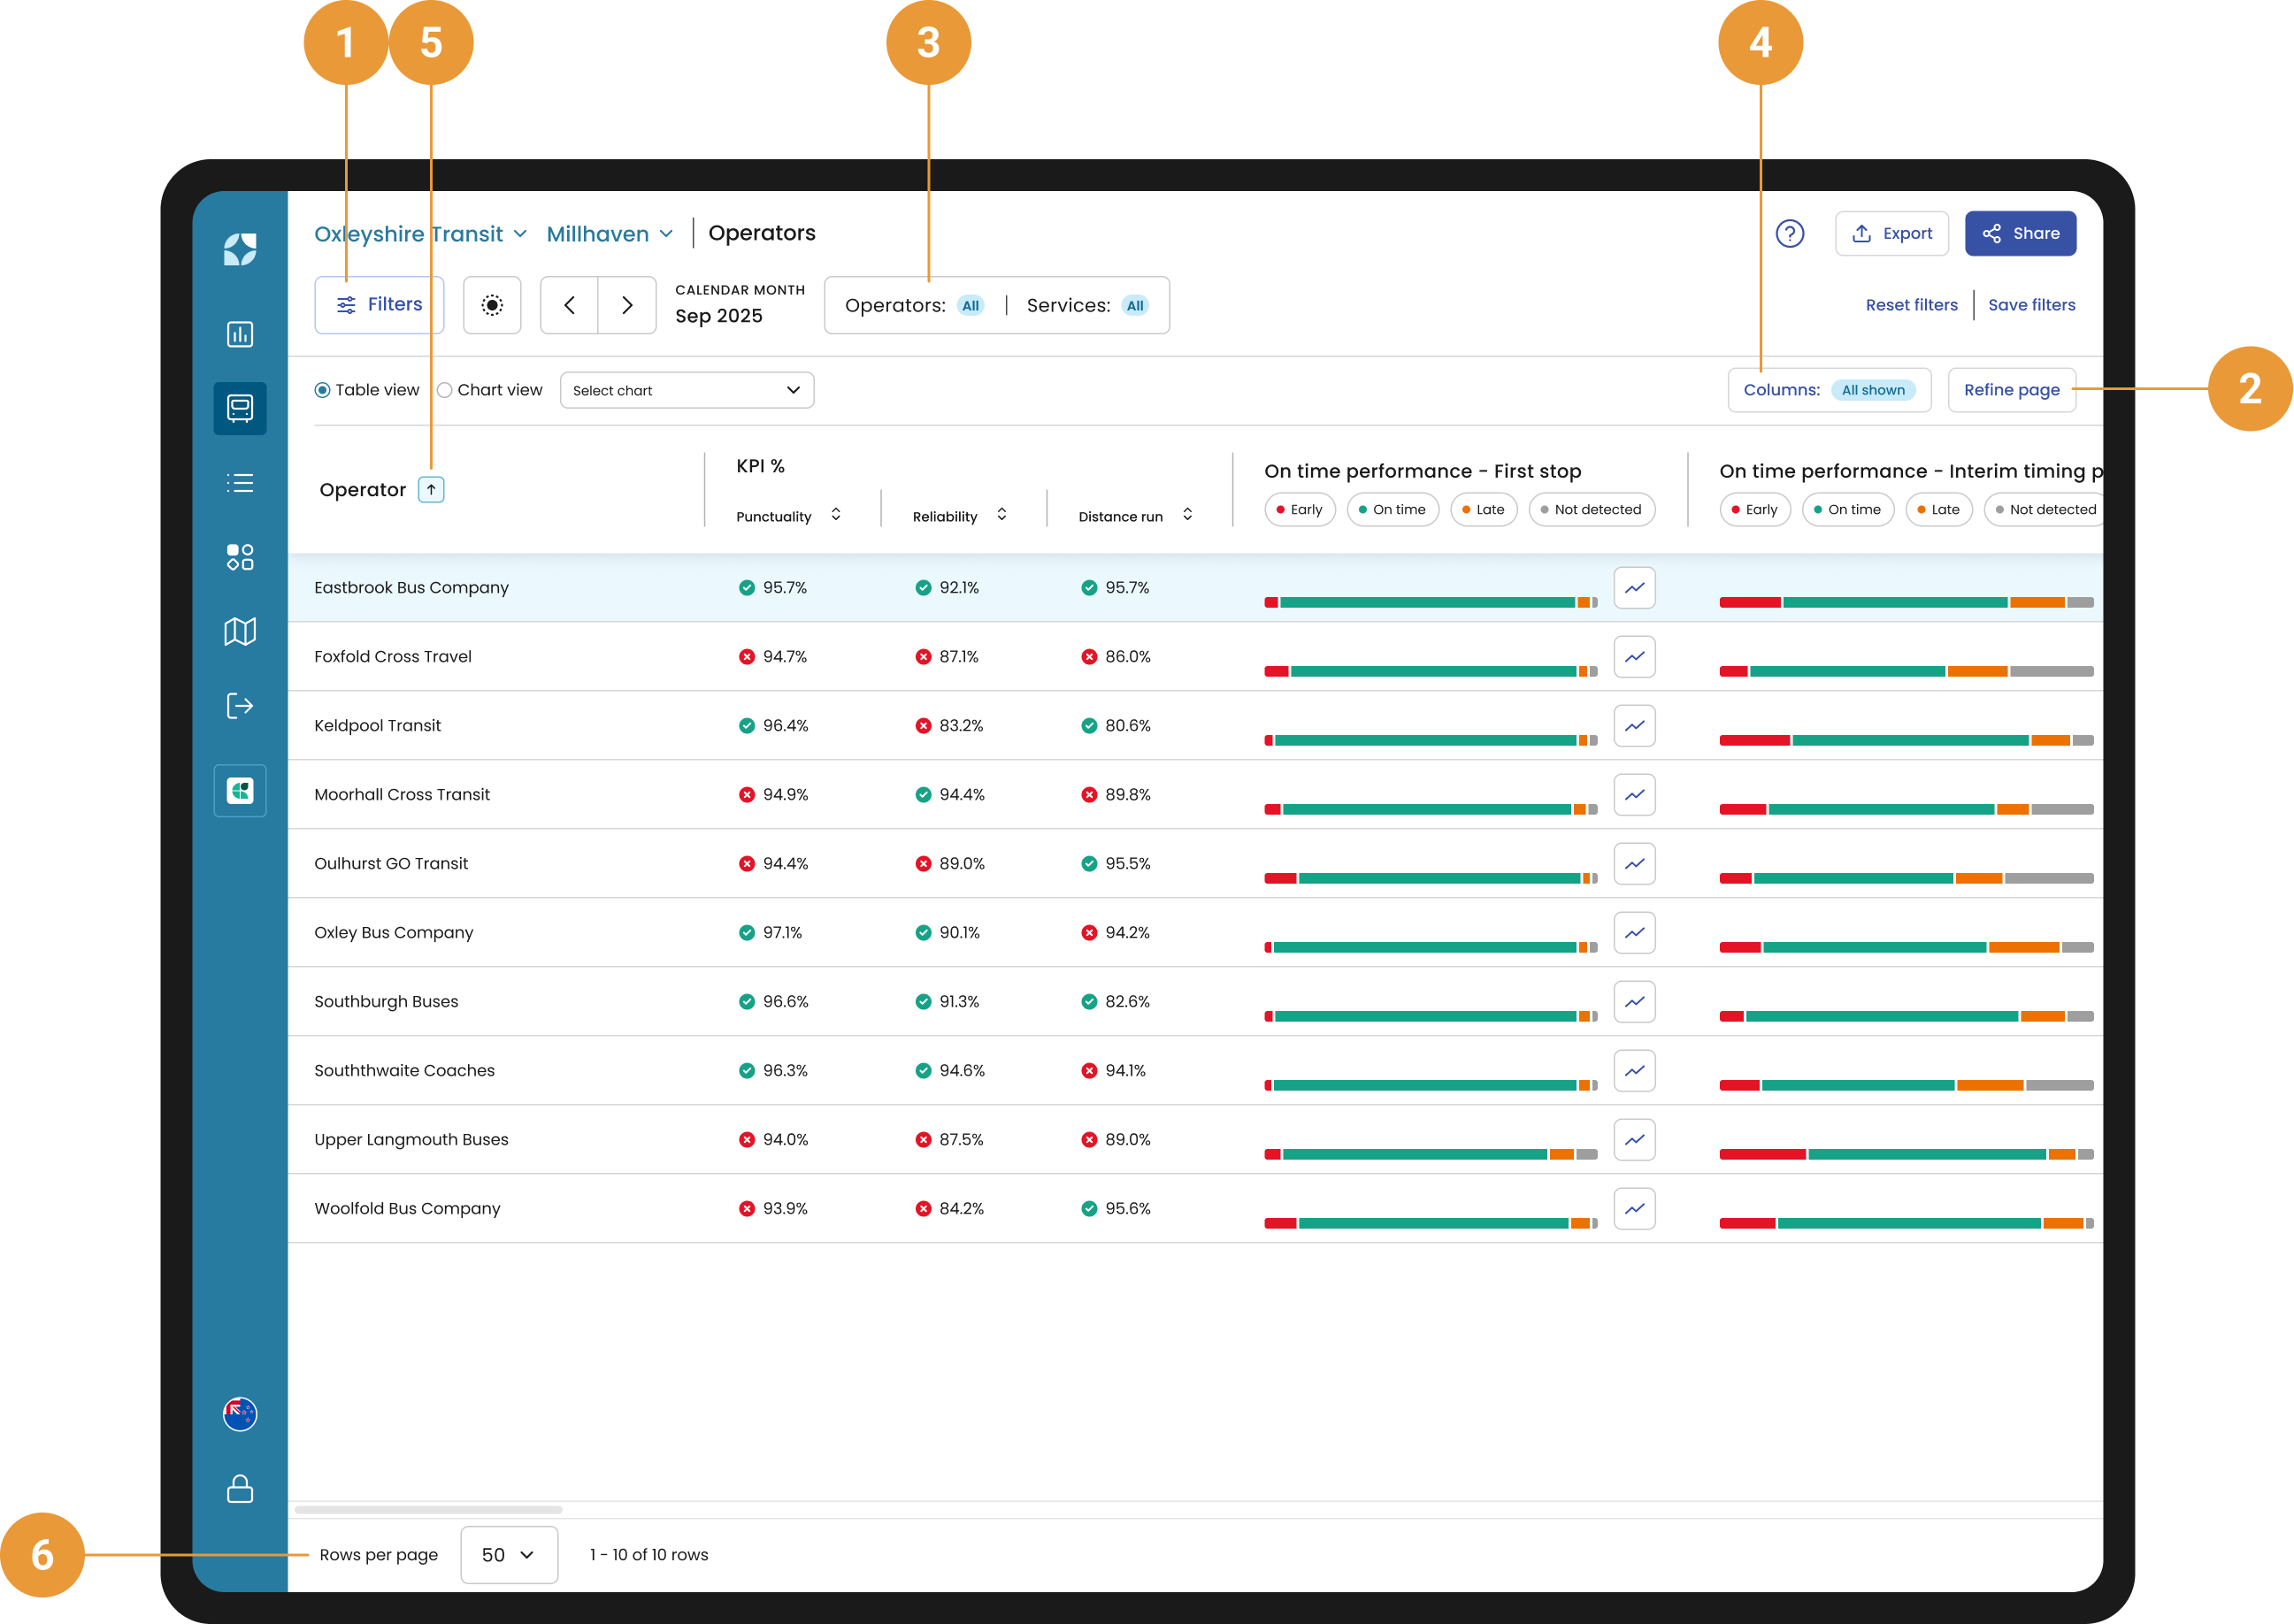
Use the filter hub (1) to select a specific date range to view.
-
Use the refine page button (2) to select which operators to view on this page. The operators field will automatically be populated with the value from the page you have drilled down from. Any selection of operators from within the global operators/services filter (3) will influence what operators are available to be selected from within the refine page panel. Use the global operators/services filter if you want to compare multiple operators for the selected date range. Each selected operator is shown in alphabetical order by default.
It is possible to view the performance of a subset of services for an operator. For example, if you remove all school services from an operator, Mosaiq will display the performance for that operator excluding school services run by that operator.
-
Use the Columns button (4) to select which columns to display in the table.
-
Click on the column headers to sort the data as you wish – sorting arrows will appear to indicate which column the data is sorted by and in which direction (5). Sort data from lowest to highest or vice versa by operator, punctuality, reliability, distance or journeys matched metrics.
-
Your results will be shown in the table – you can specify how many rows you want to view per page, or you can use the tabs to the right to skip through the data page by page (6).
On-time performance
-
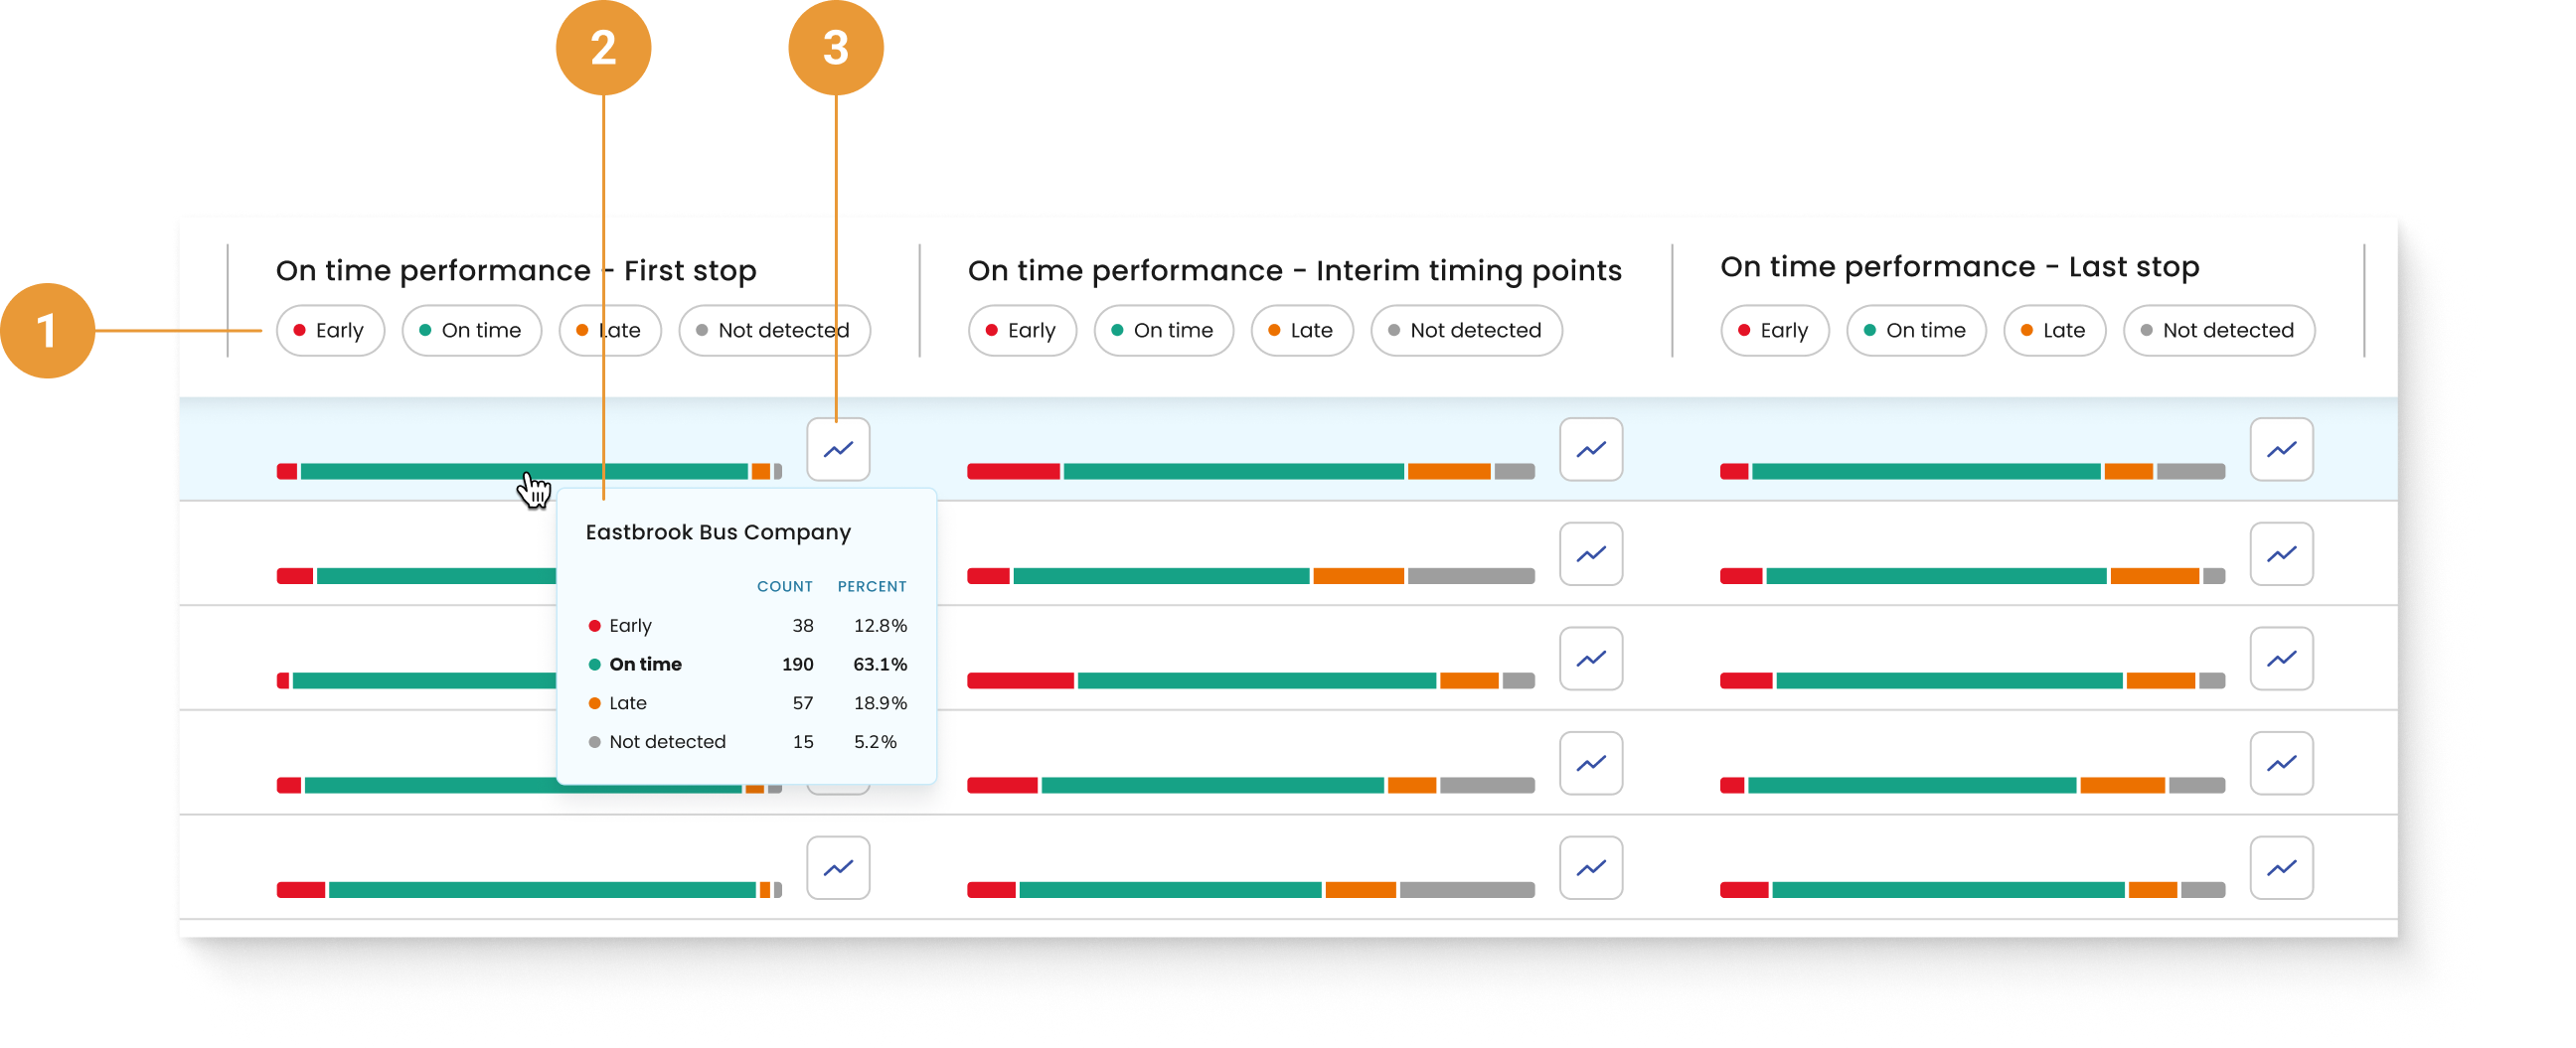
On-time performance is available for First stop, Interim timing points and Last stop.
-
The early, on-time, late and not detected buttons will sort data accordingly, working in the same way as the On-time performance chart (1).
-
A tooltip is available to view the on-time performance data in detail by hovering over the bar summary. (2)
-
You can navigate to the on-time performance chart for a specific operator by clicking the graph icon. (3)
Distance
-
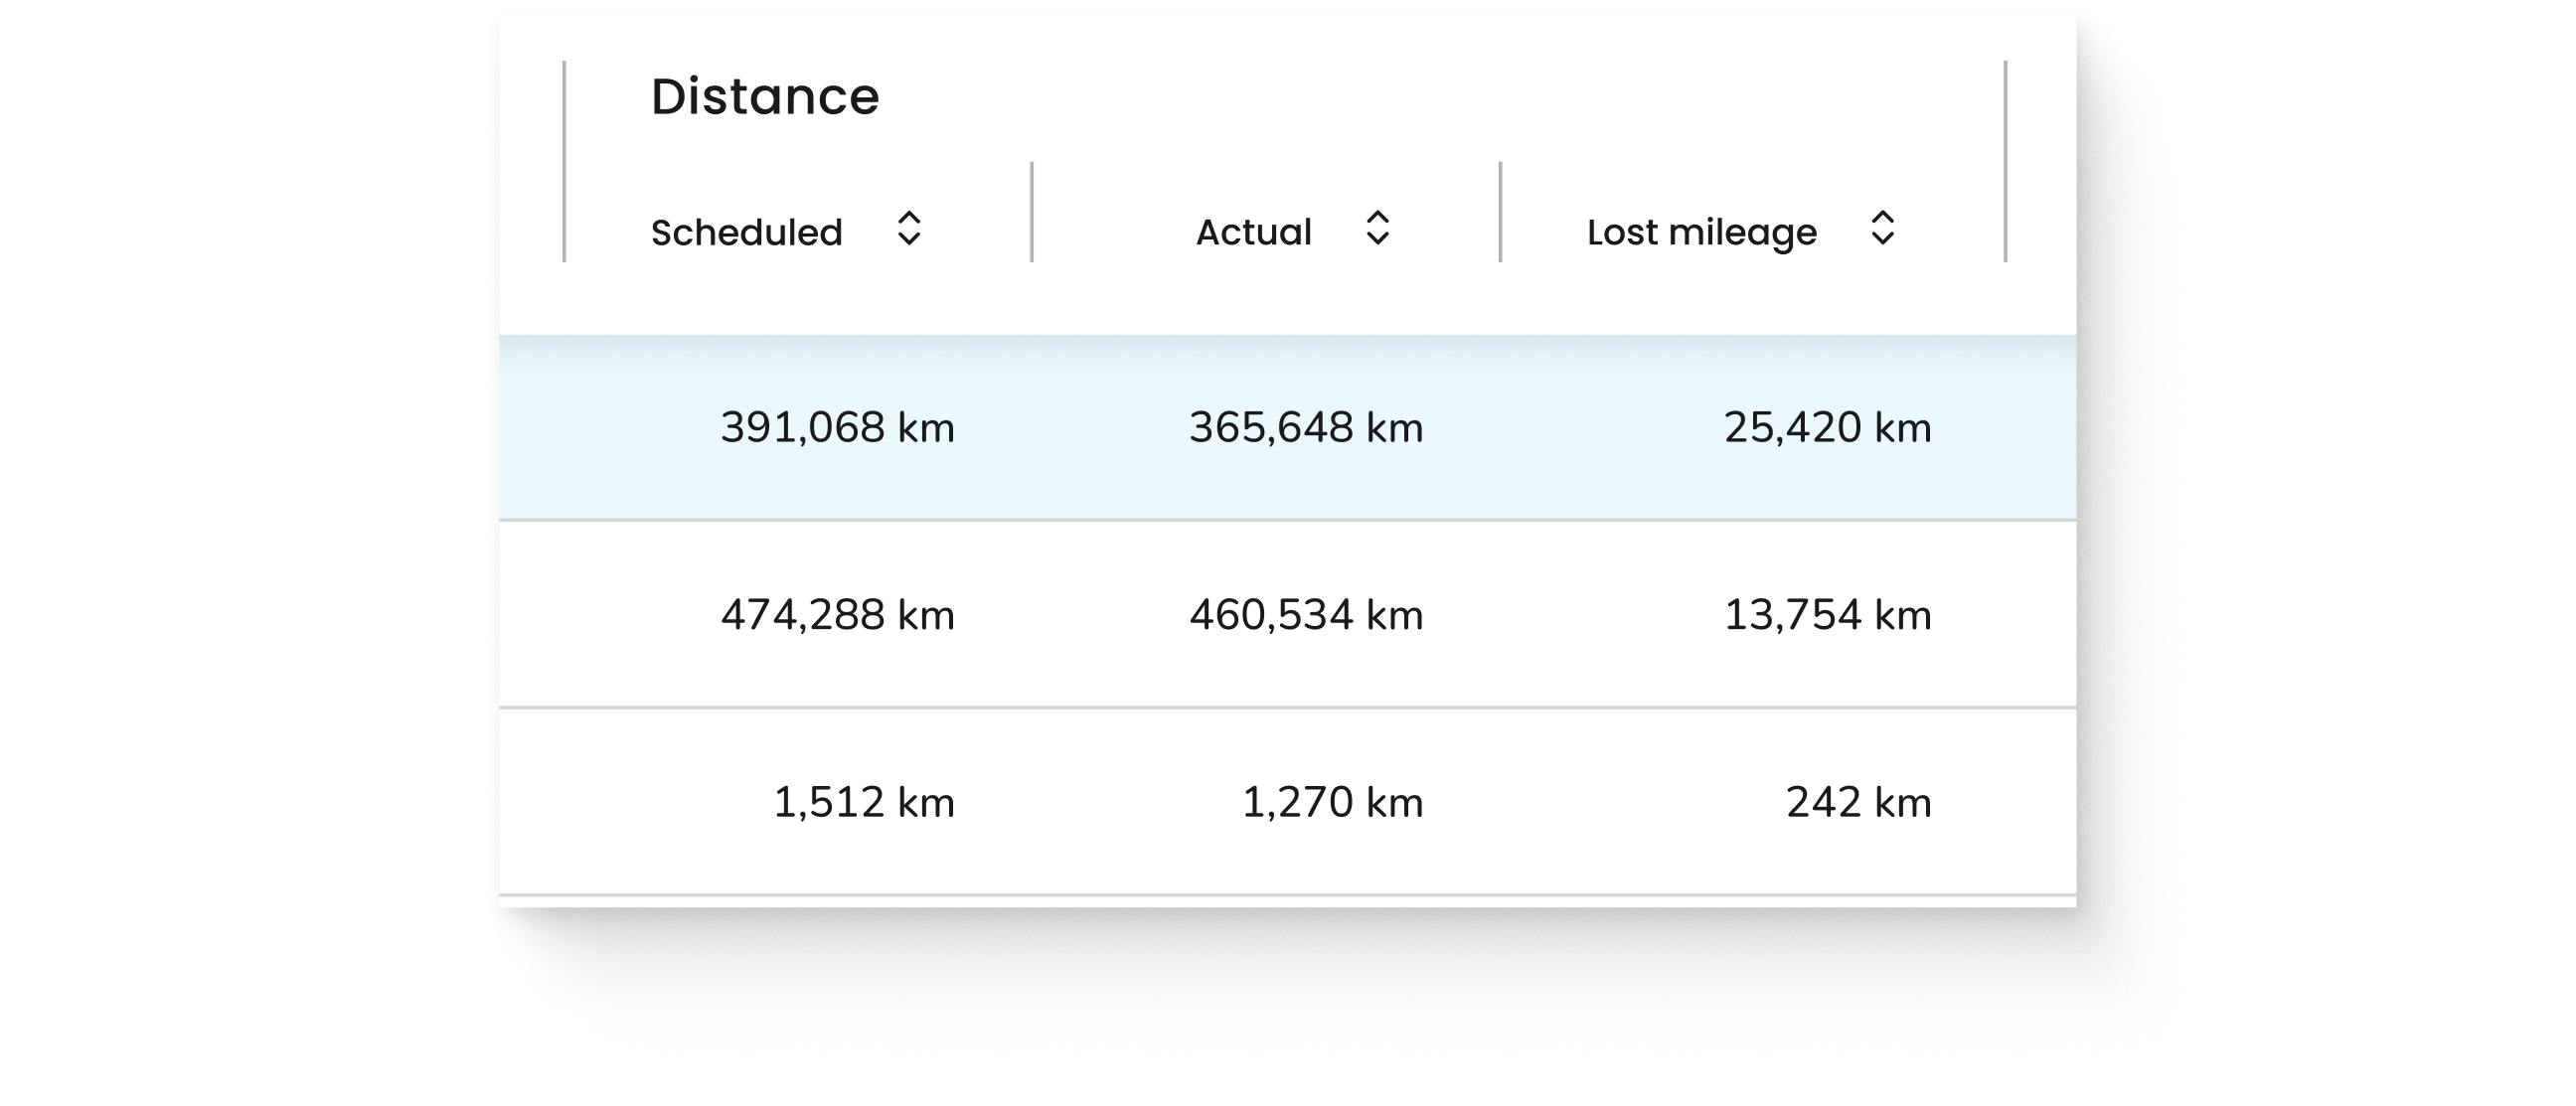
Distance metrics are available for all customers who provide
shape_dist_traveledin either theshapes.txtorstop_times.txtfiles with their GTFS upload. -
This distance dataset will include the scheduled distance, actual distance run and the lost miles for each operator for the selected period.
Journeys
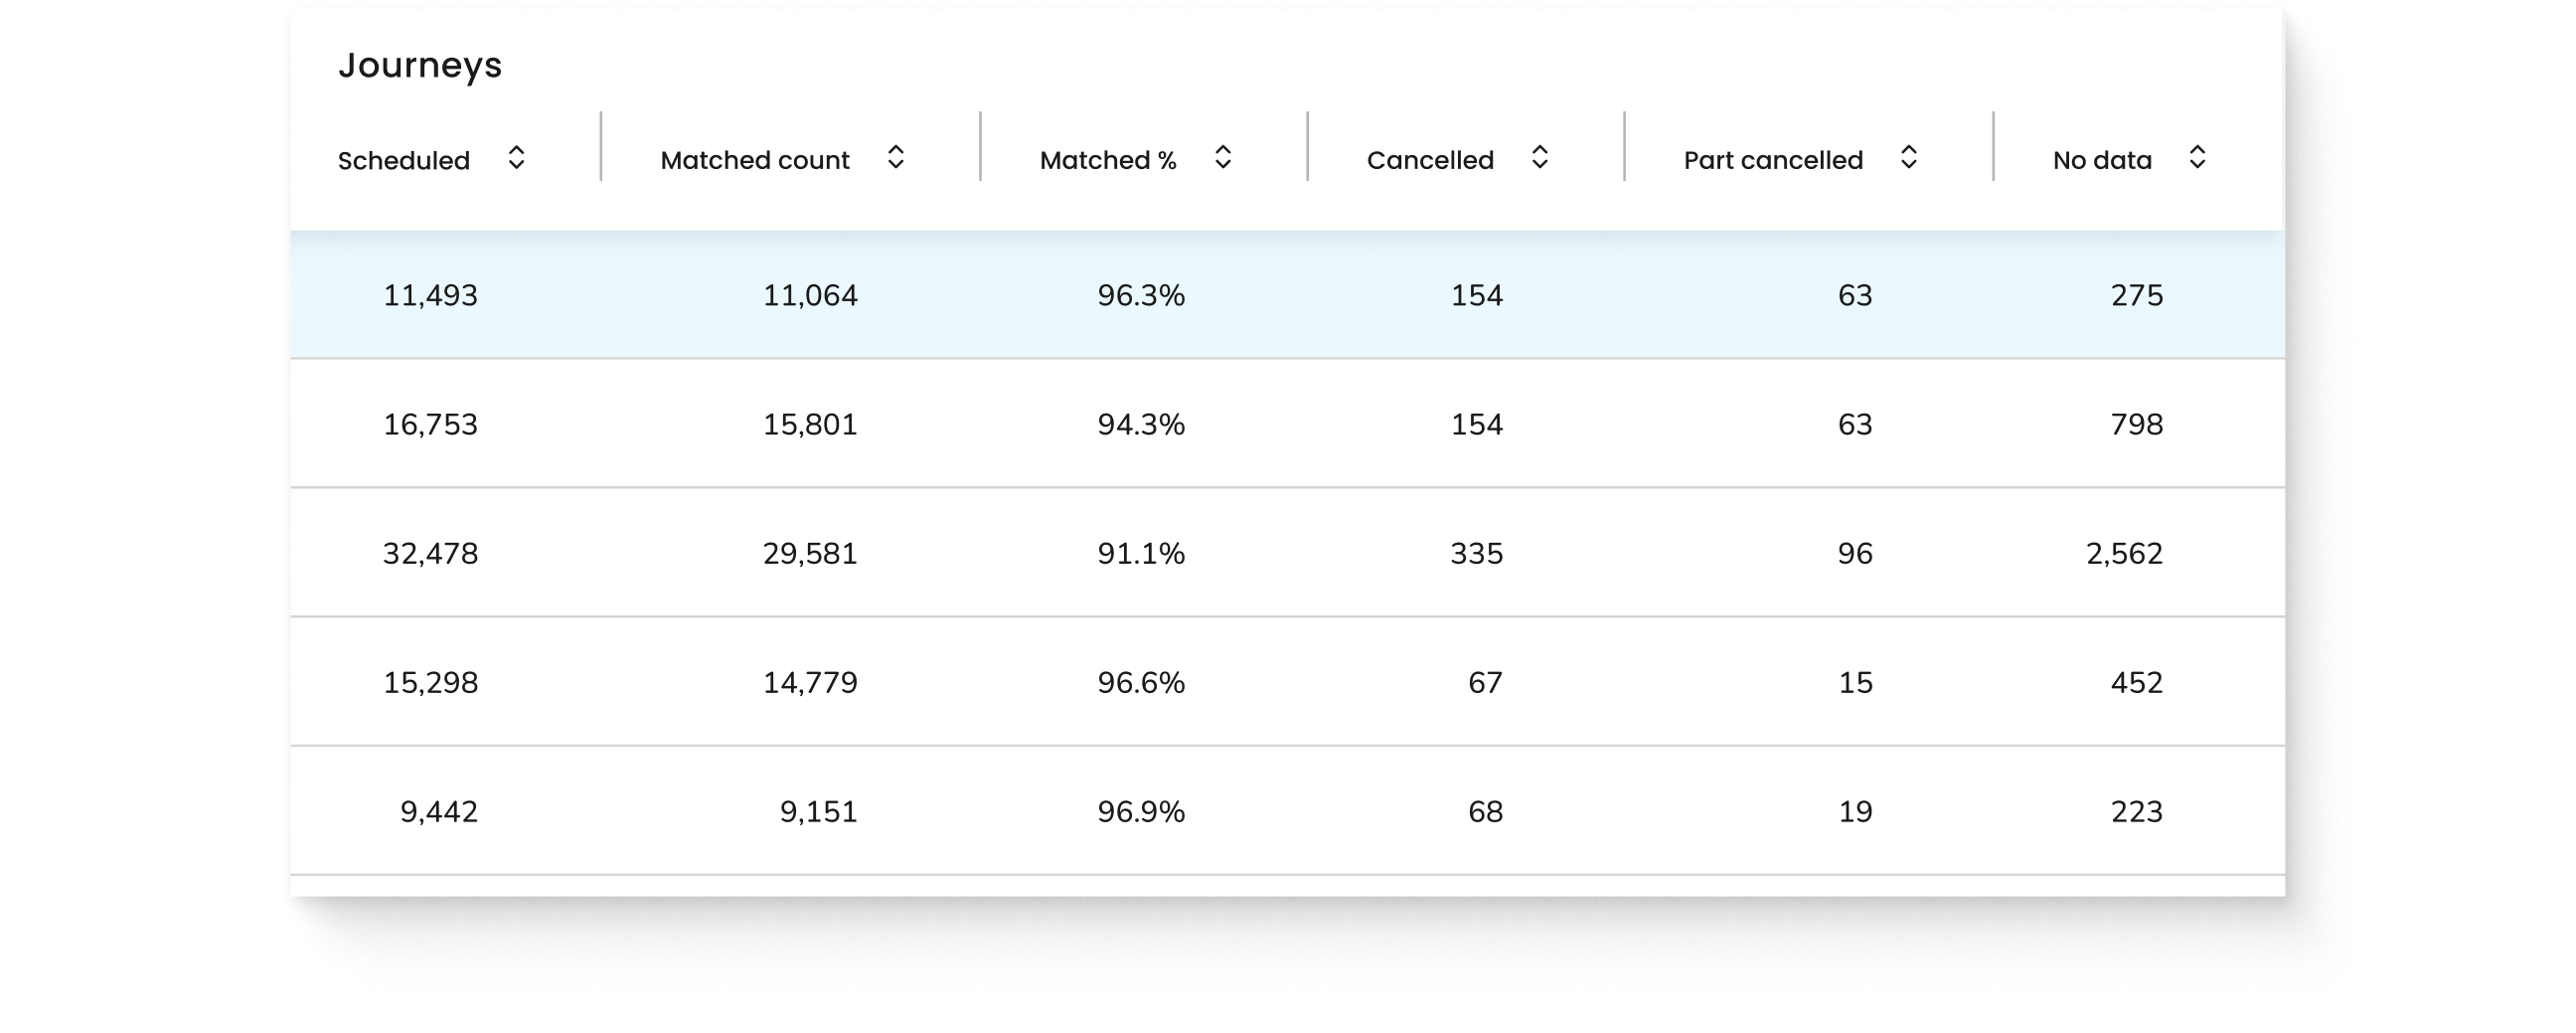
-
The Journeys category captures the number of completed journeys, journeys scheduled, the matched count, matched percentage, cancelled, part cancelled and no data columns.
The no data column is calculated as: (scheduled - matched count - cancelled = no data)