
The Punctuality failure indicators chart give a high level overview of which operators or services are failing punctuality and reliability KPIs.
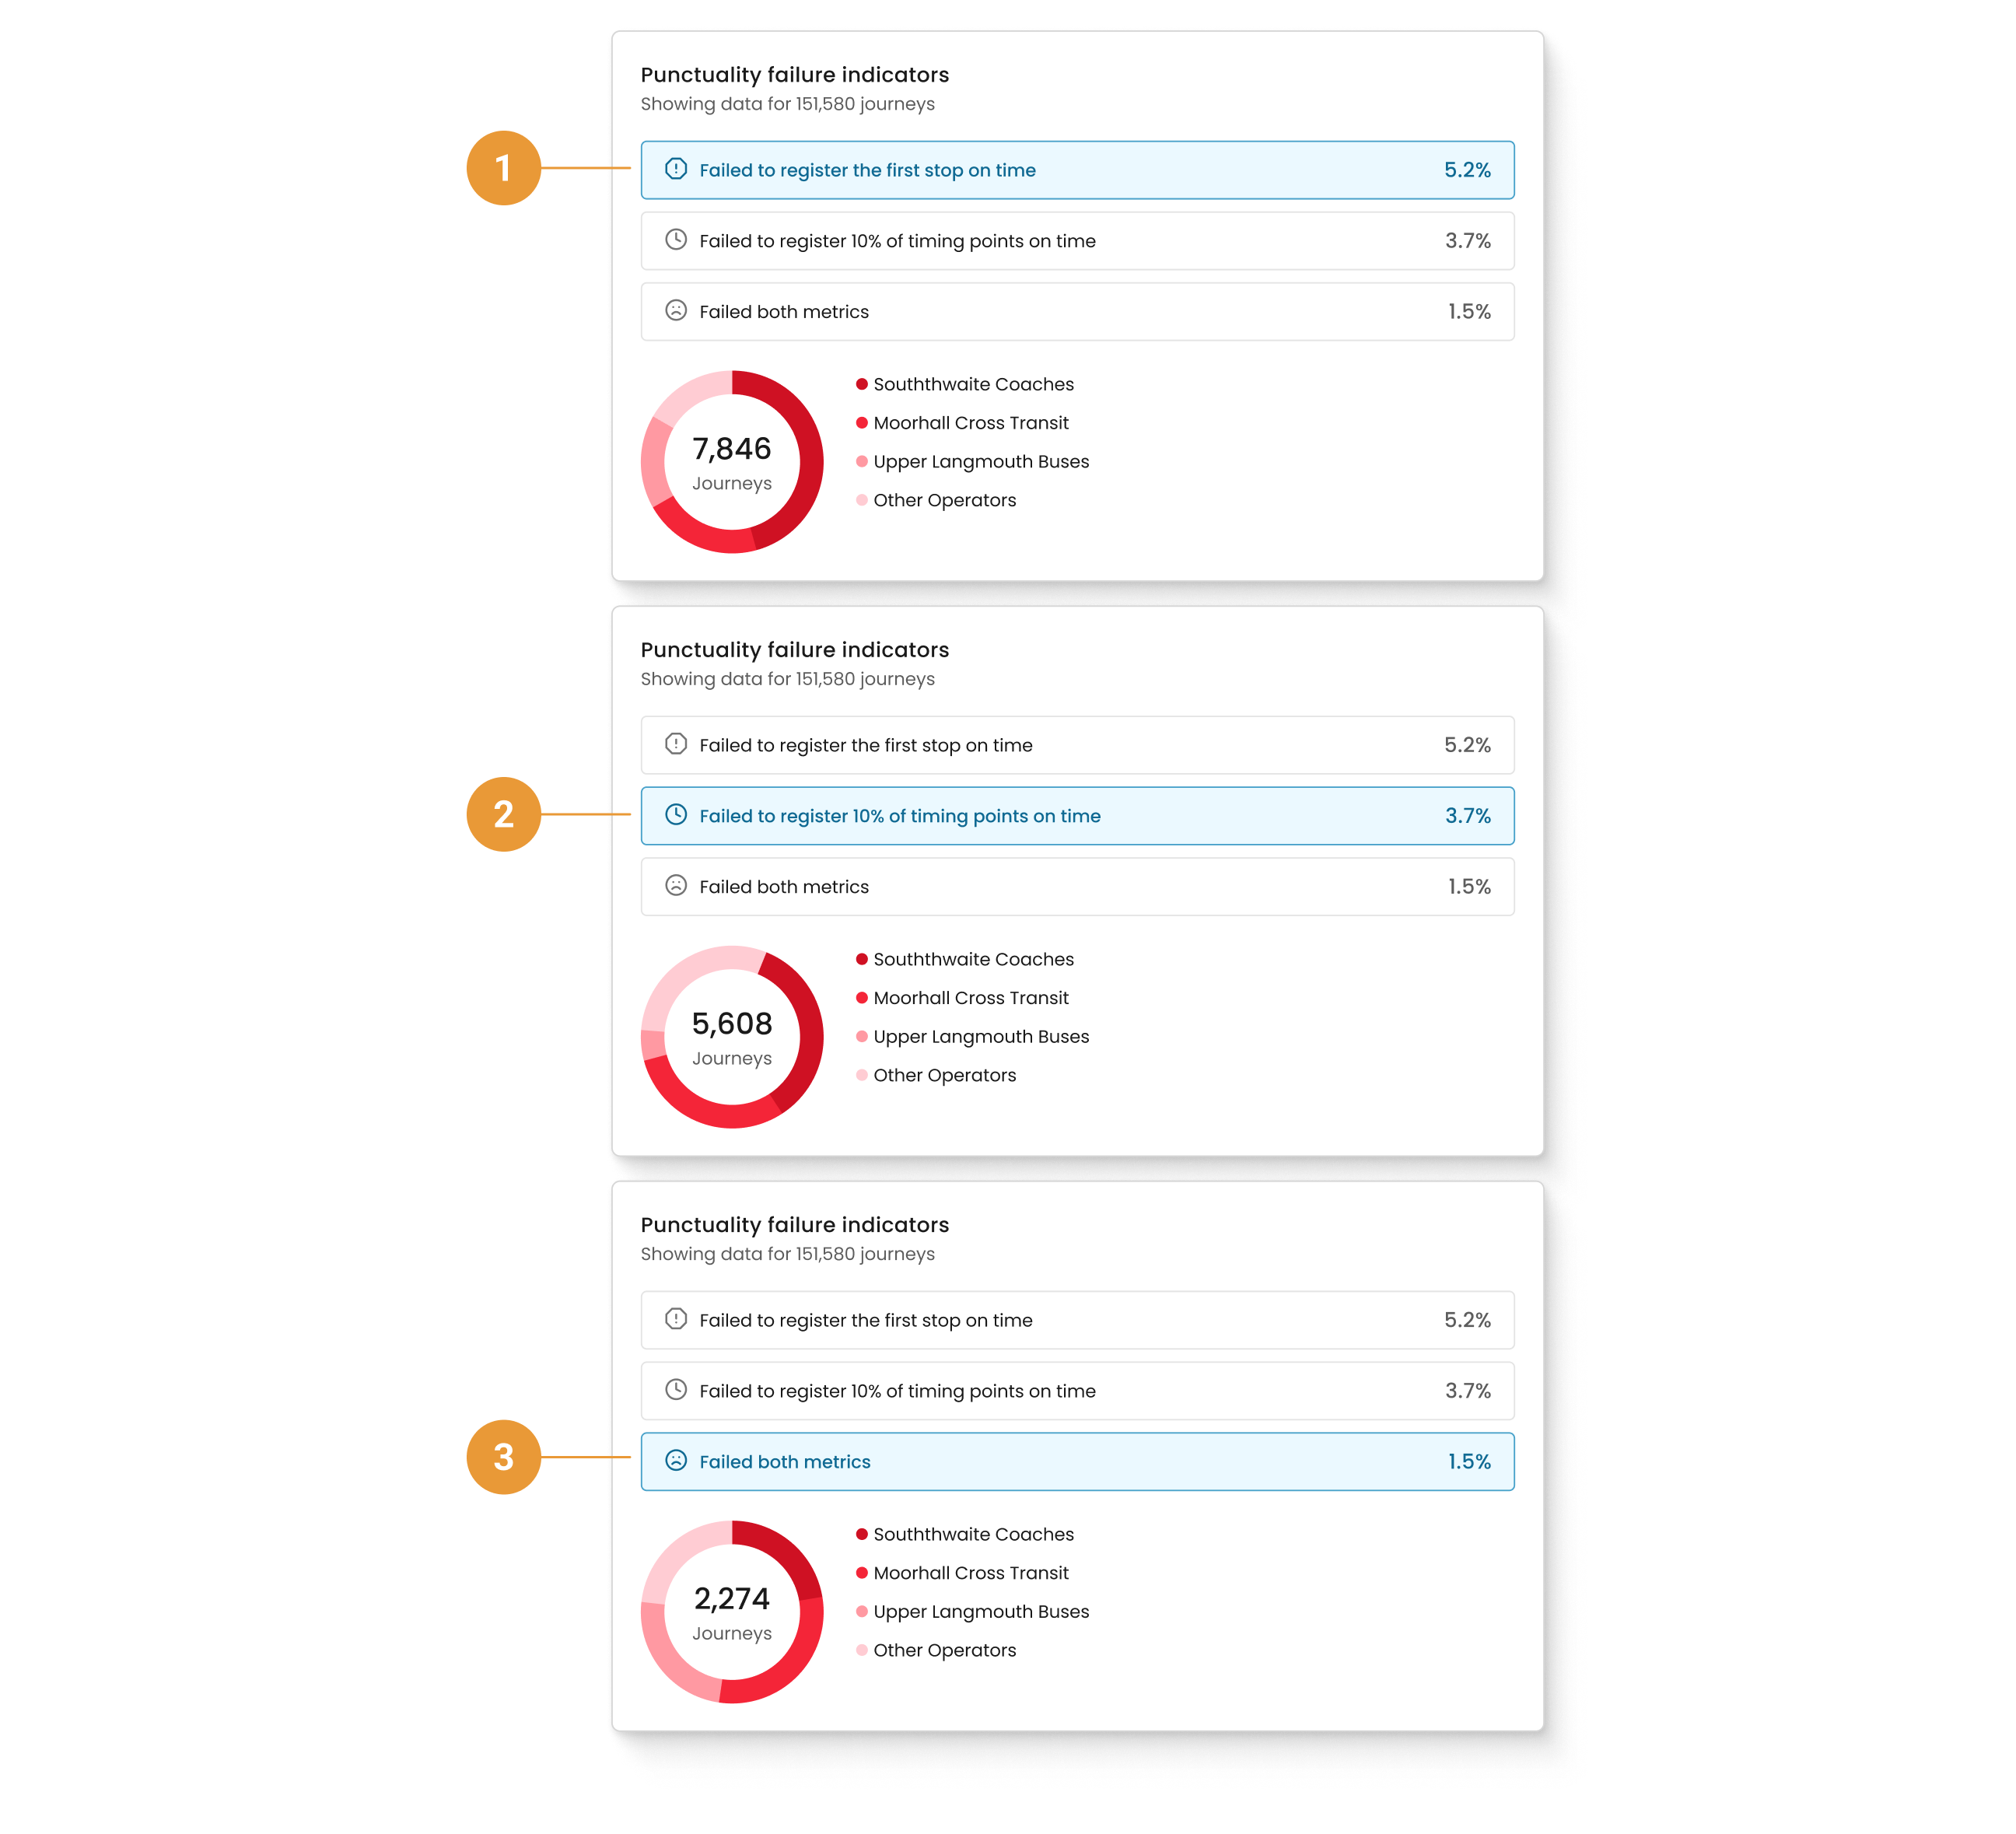
Category 1 is always pre-selected, and the donut chart to the right gives more details specific to the category selected.
The three key causes of failure have been summarized and are shown on the buttons on the left:
-
Failed to register at the first stop on time (1).
-
Failed to register 10% of timing points on time (2).
-
Failed both metrics (3).
Example
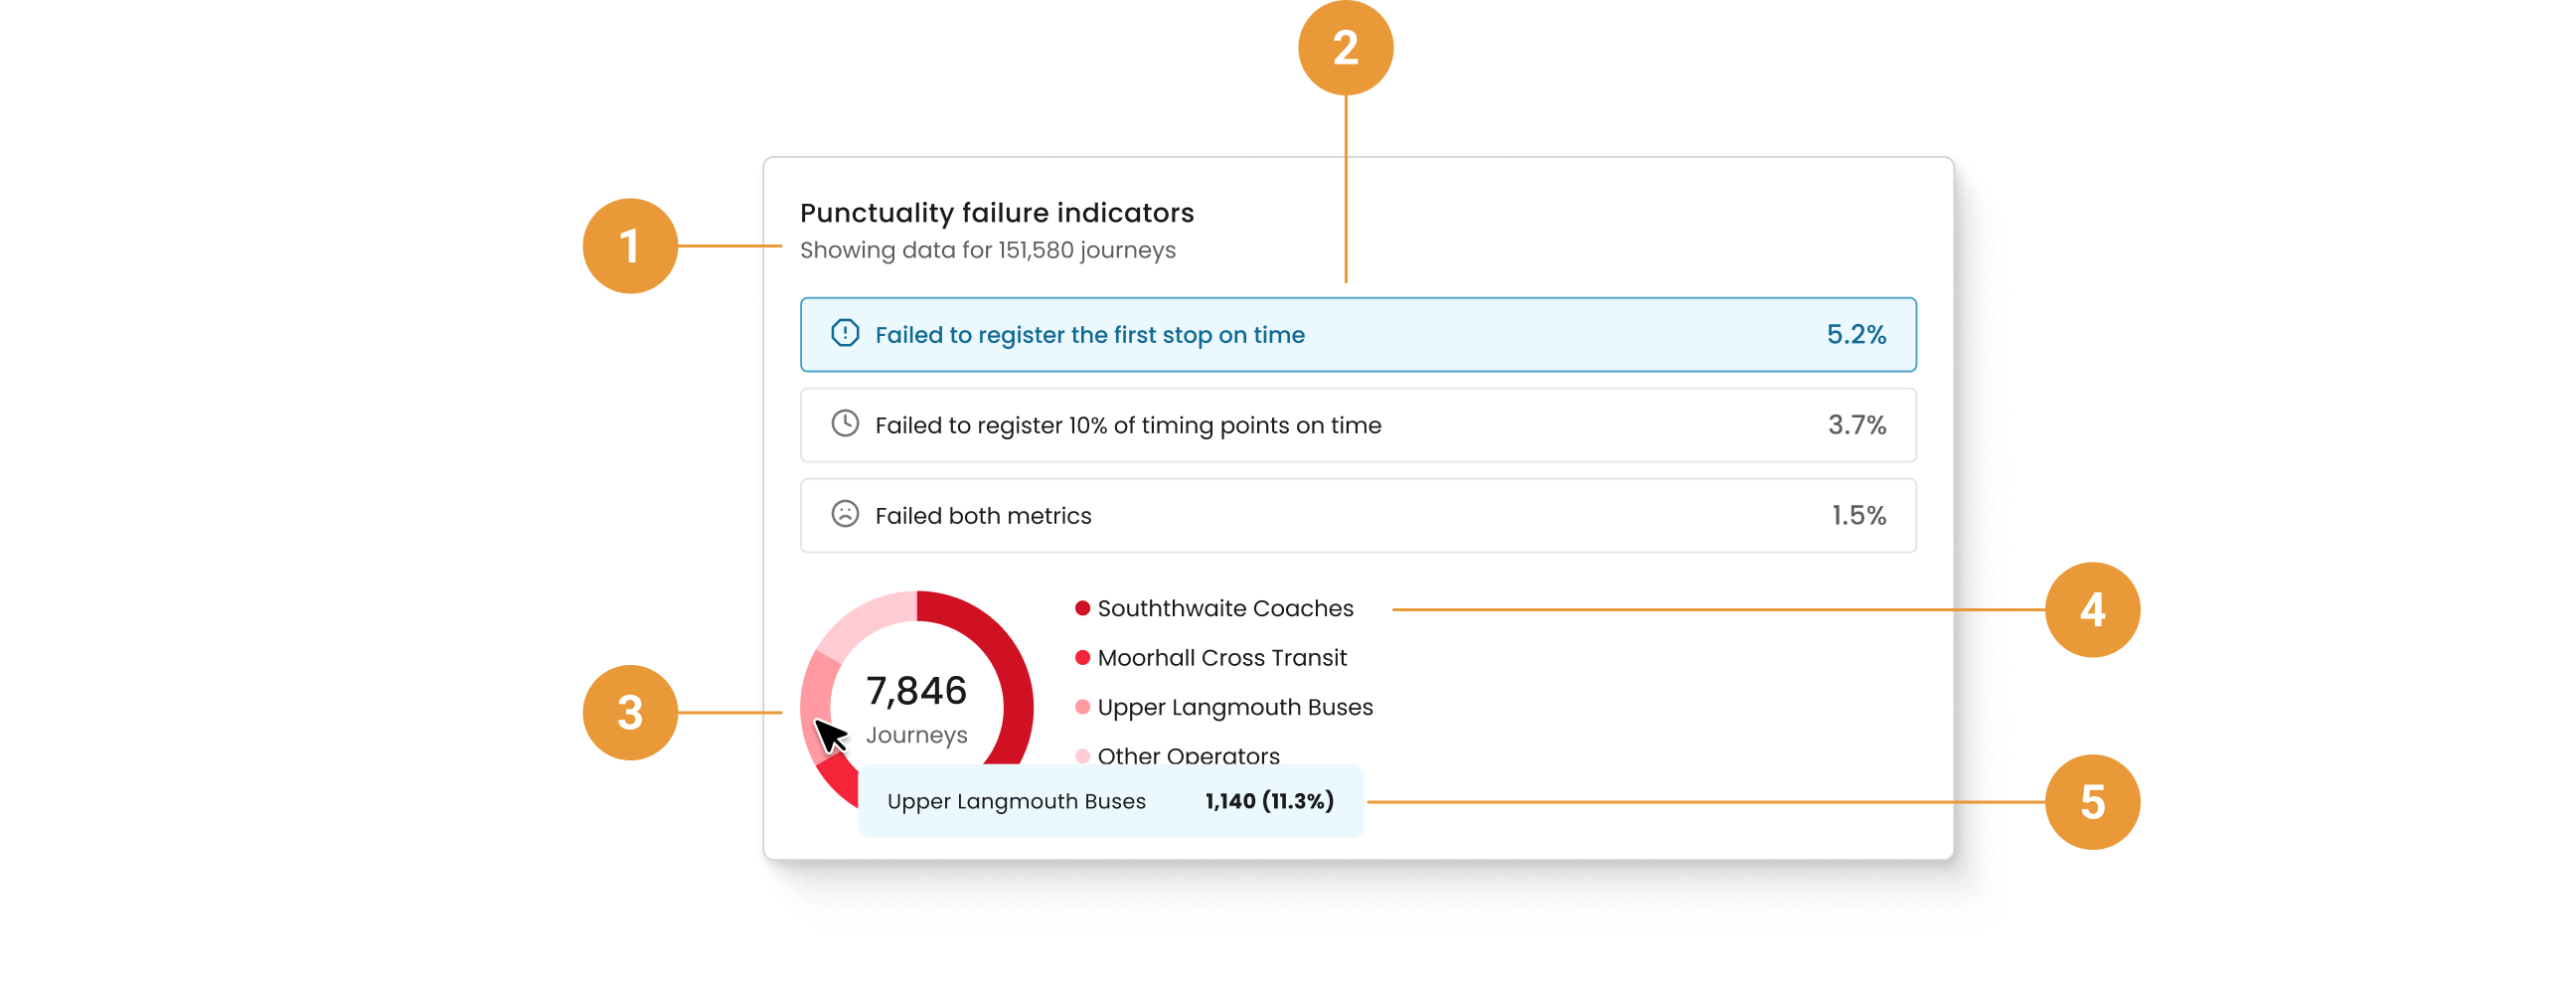
Of the data collected for 151,580 matched journeys (1), 5.2% of the journeys “failed to register at the first stop on time” (2). As this category is selected, we can see in the donut chart to the right that 5.2% equates to 7,846 journeys (3). We can also see the top three operators contributing to the performance data (4), with their percentage contributions indicated on the donut chart.
Hovering over the donut sections reveals the operator name, journey count and percentage contribution to the whole (5).