
The chart section of the KPI tabs is designed to give you an overview of the performance of your network by operator and by service.
Click on an operator or service name to dive deeper into the data.
-
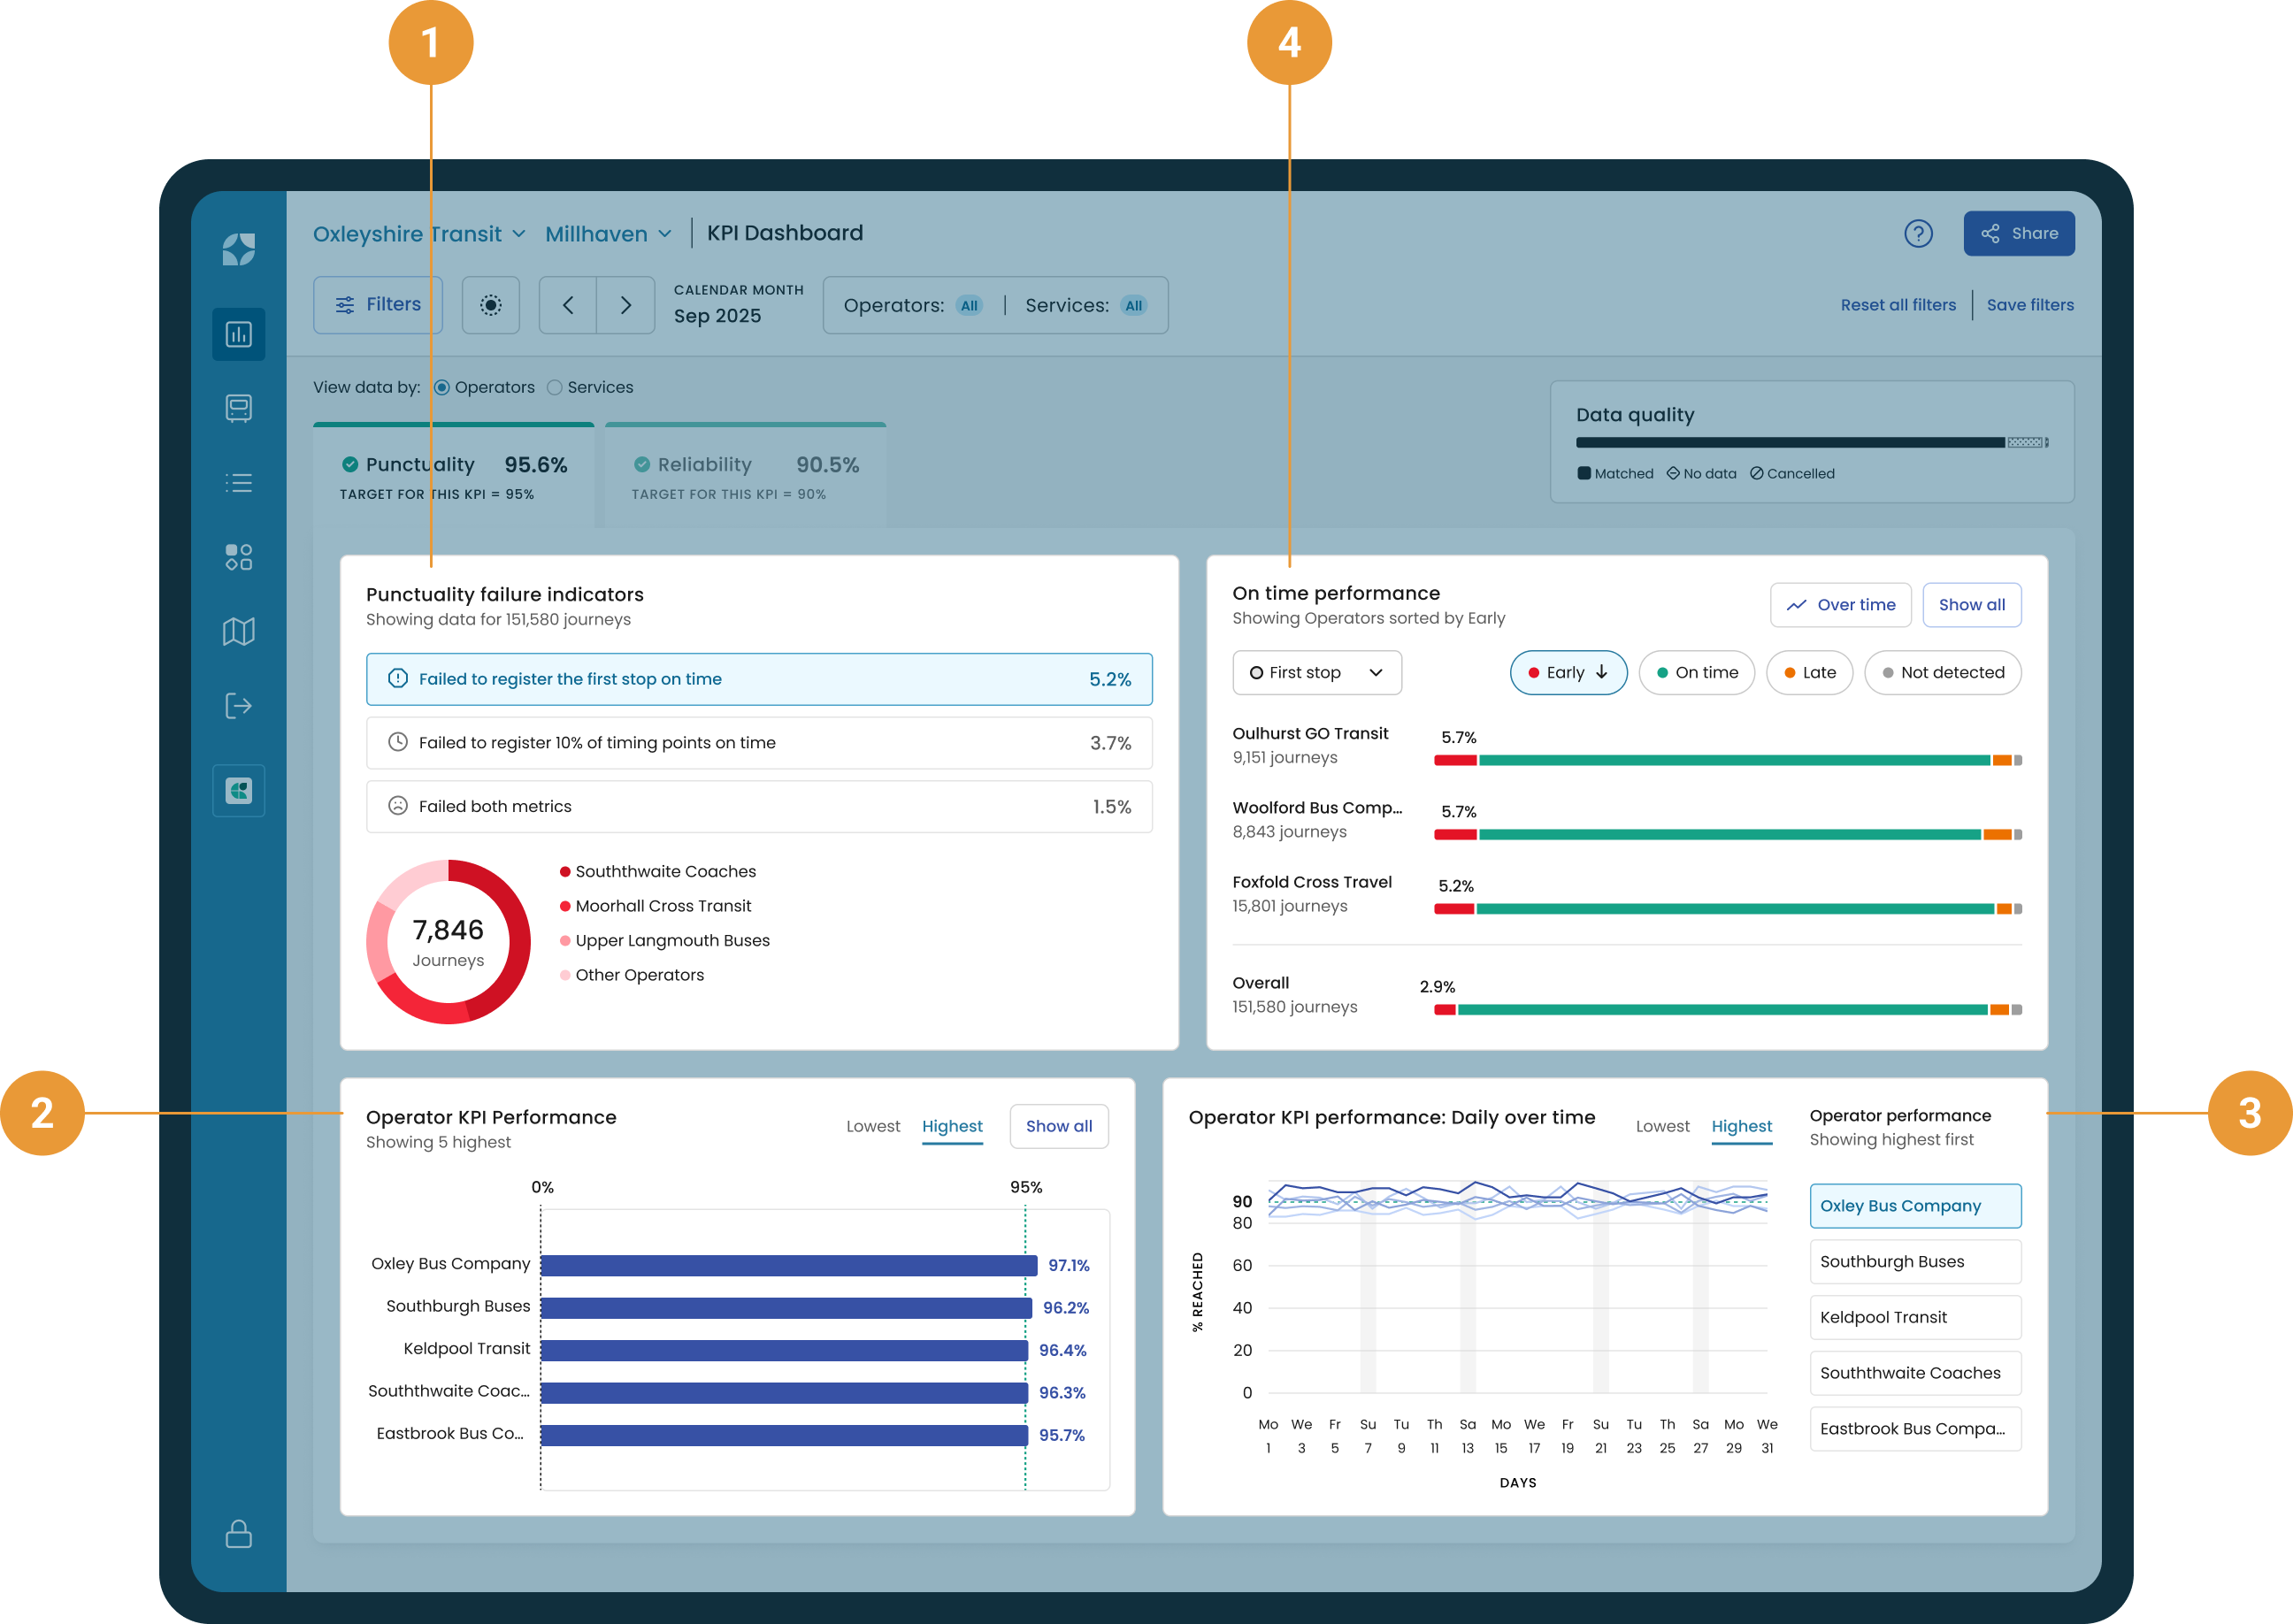
Punctuality Failure Indicators summarise the three key causes of failure and breaks them down by operator (1).
-
Punctuality KPI performance highlights the five highest and lowest performing operators (2).
-
Punctuality KPI performance daily over time gives a data view for the five highest or lowest performing operators (3).
-
On time performance chart highlights early, on-time and late (EOL) performance of operators or services (4).