A summary of the Total journey and Segments running times performance is available throughout Mosaiq Insights. These visualisations provide a view of the proportion of journeys or segments that ran shorter, as expected, or longer than scheduled.
Shorter and longer running times refer to deviations in the time it takes for a vehicle to complete its journey along a route, or segment of, compared to the scheduled, or expected time.Segment is defined as a portion of a trip for running time assessment and could represent either a stop to stop, a timing point to timing point, or from a previous timing point to the current stop.By default, shorter and longer running times are defined as either 10% shorter or 10% longer than the scheduled running time. Therefore, the user defined highlight thresholds do not affect the Total journey and Segments bar graphs.
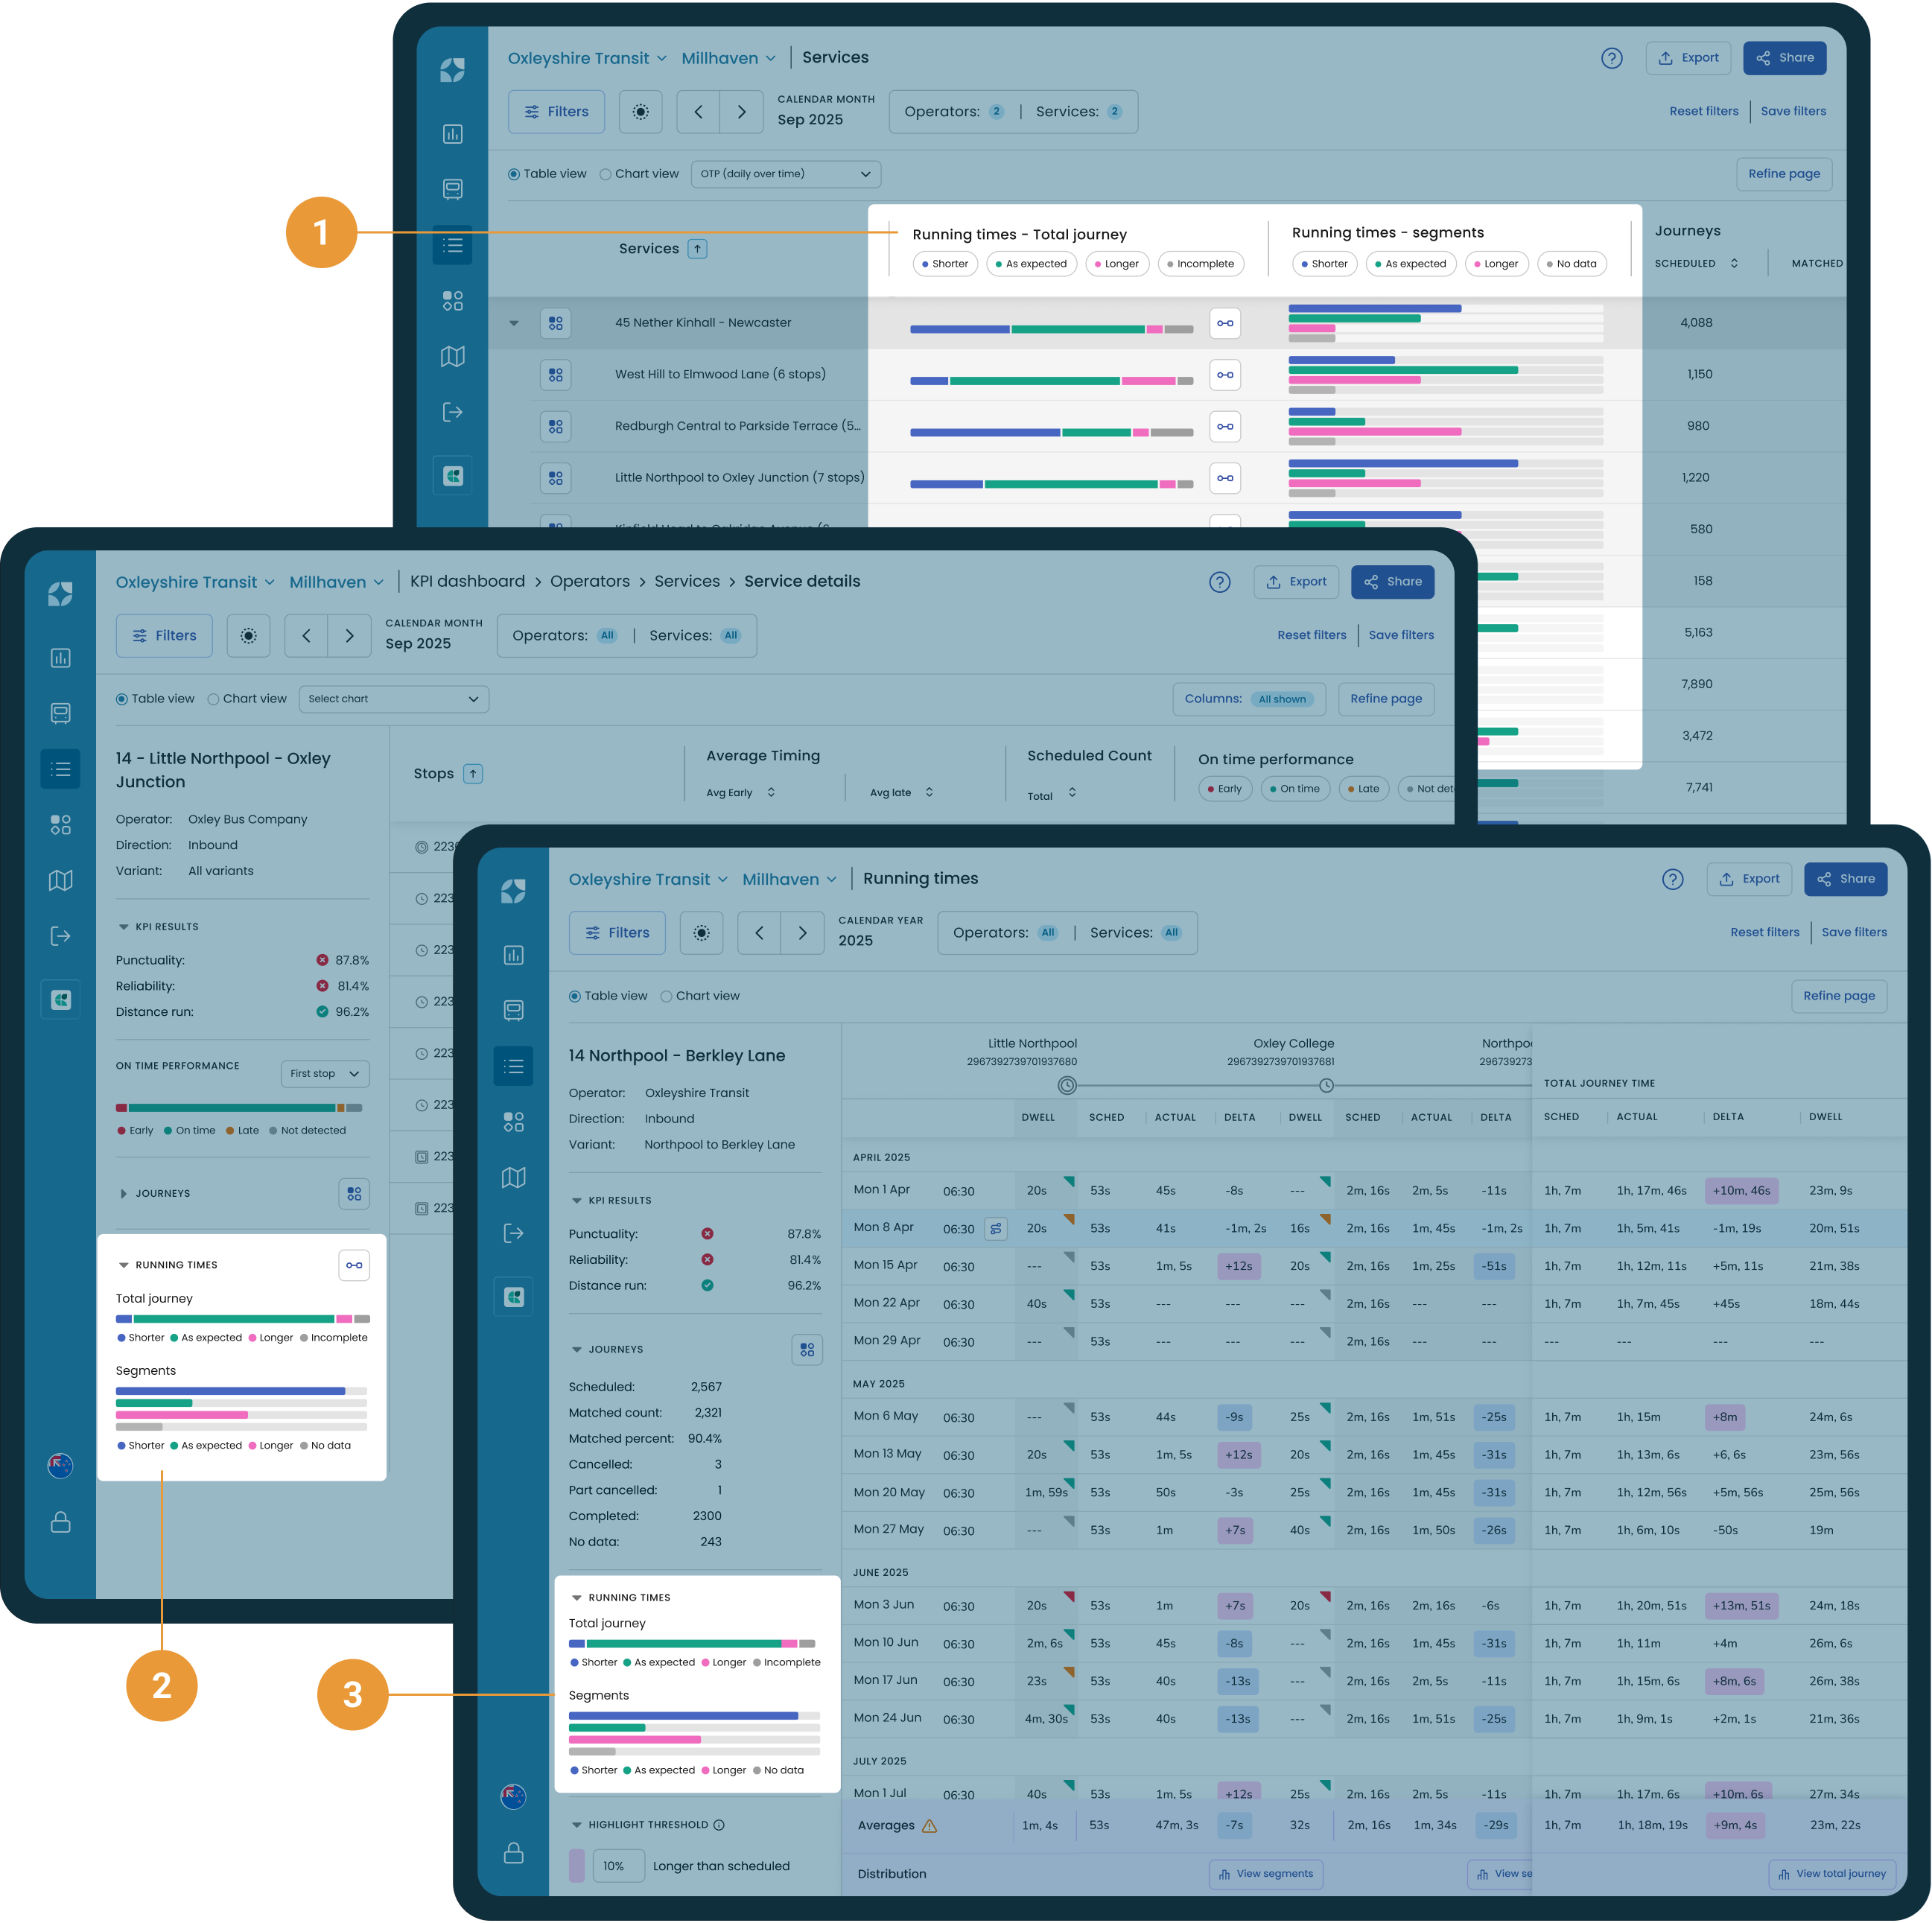
The Running times - Total journey and Running times - Segments bar charts are available within:
-
Services (1)
-
Service details side panel (2)
-
Running times side panel (3)
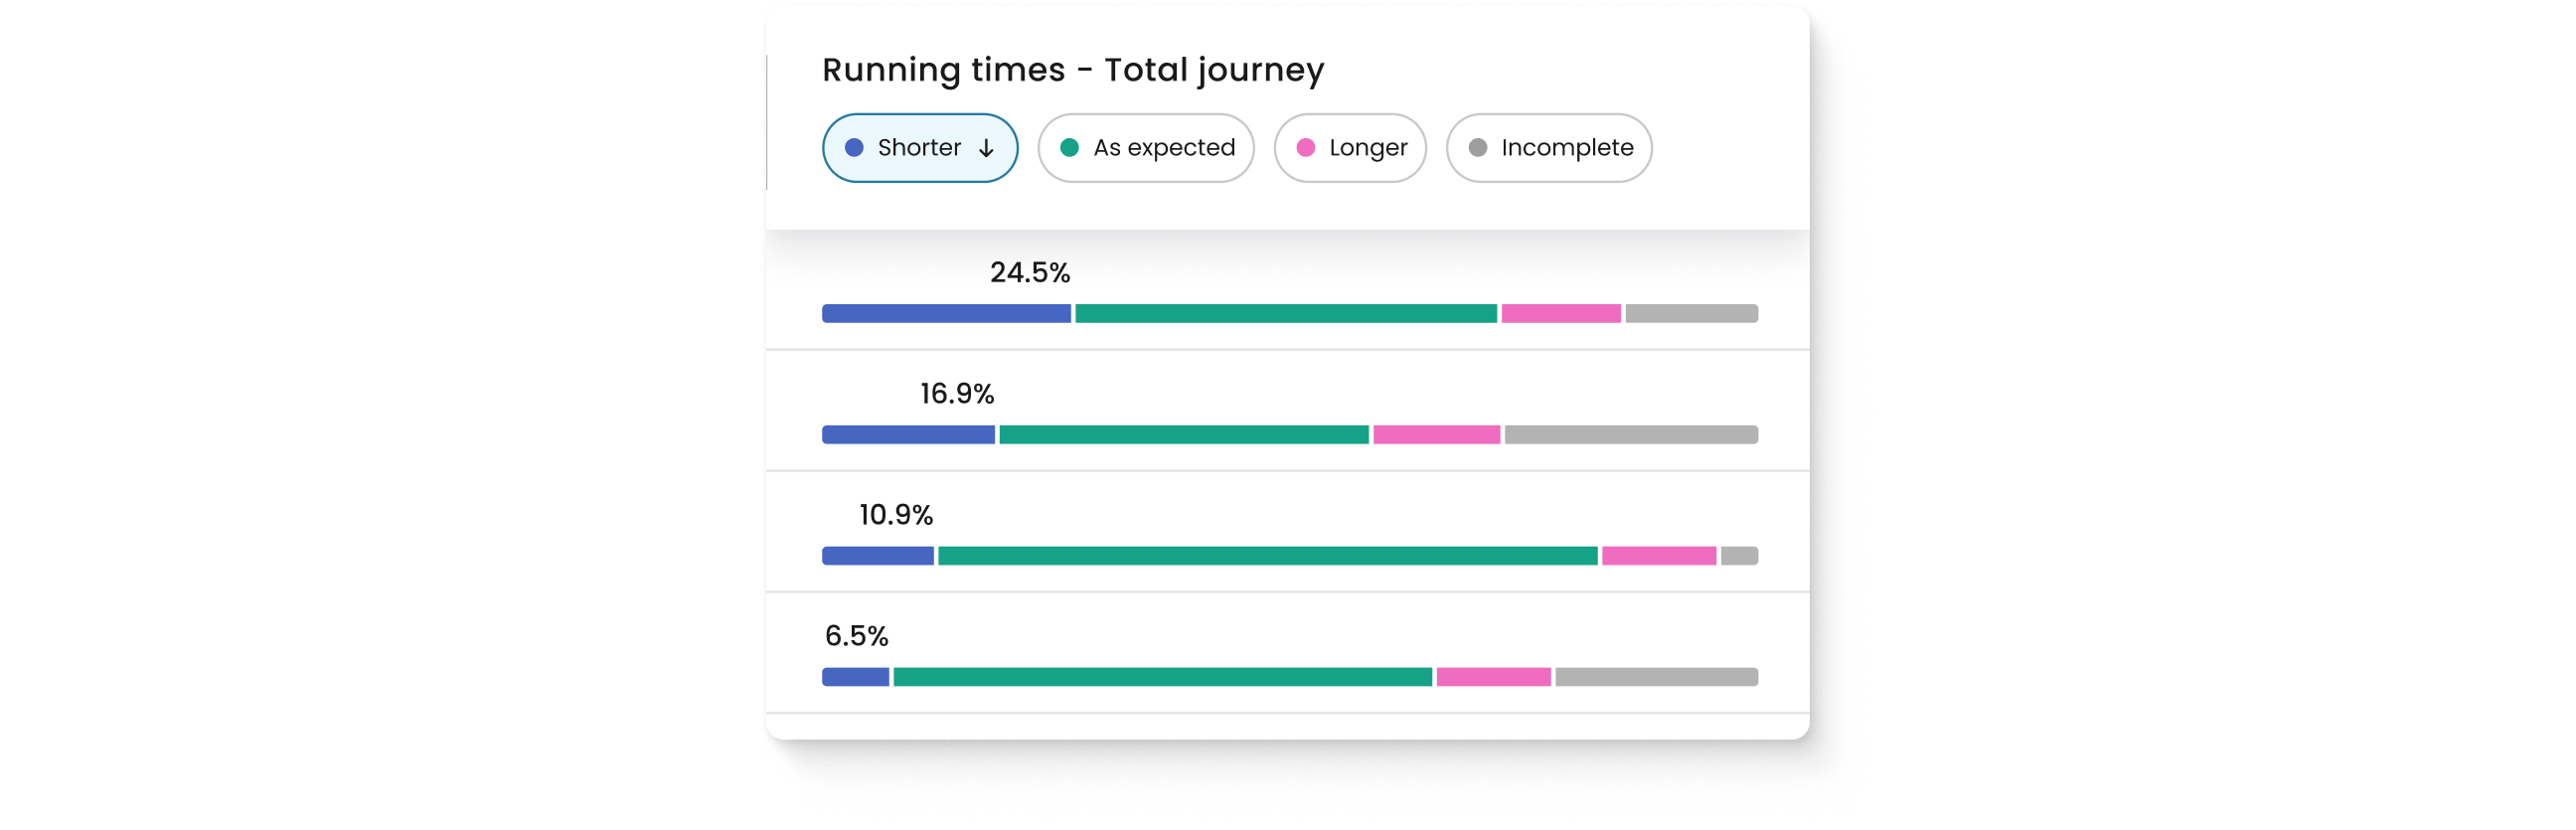
Running times - Total journey
The Running times - Total journey chart provides a summary of the performance of the total journey duration for completed journeys of the selected Service in terms of the proportion of completed journeys that ran shorter, as expected or longer than scheduled.
Completed journeys are those where both the first and last stop have been observed or detected.
Hovering over the chart will show a tooltip with additional information. The content within the tooltip provides both the count and percentage of all journeys within the service that were shorter, as expected, longer or incomplete. The proportion of journeys that were incomplete is provided for visibility.
Incomplete journeys are those where the first and/or last stop of a journey has not been observed or detected.Within the Services page it is also possible to order the list of services by those with the largest or smallest proportion of journeys that ran shorter, as expected, longer and incomplete using the buttons within the column header.
Running times - Segments
The Running times - Segments chart provides a summary of the performance across all segments within the selected Service in terms of the proportion of segments that ran shorter, as expected or longer than scheduled.
Segment is defined as a portion of a trip for running time assessment and could represent either a stop to stop, a timing point to timing point, or from a previous timing point to the current stop.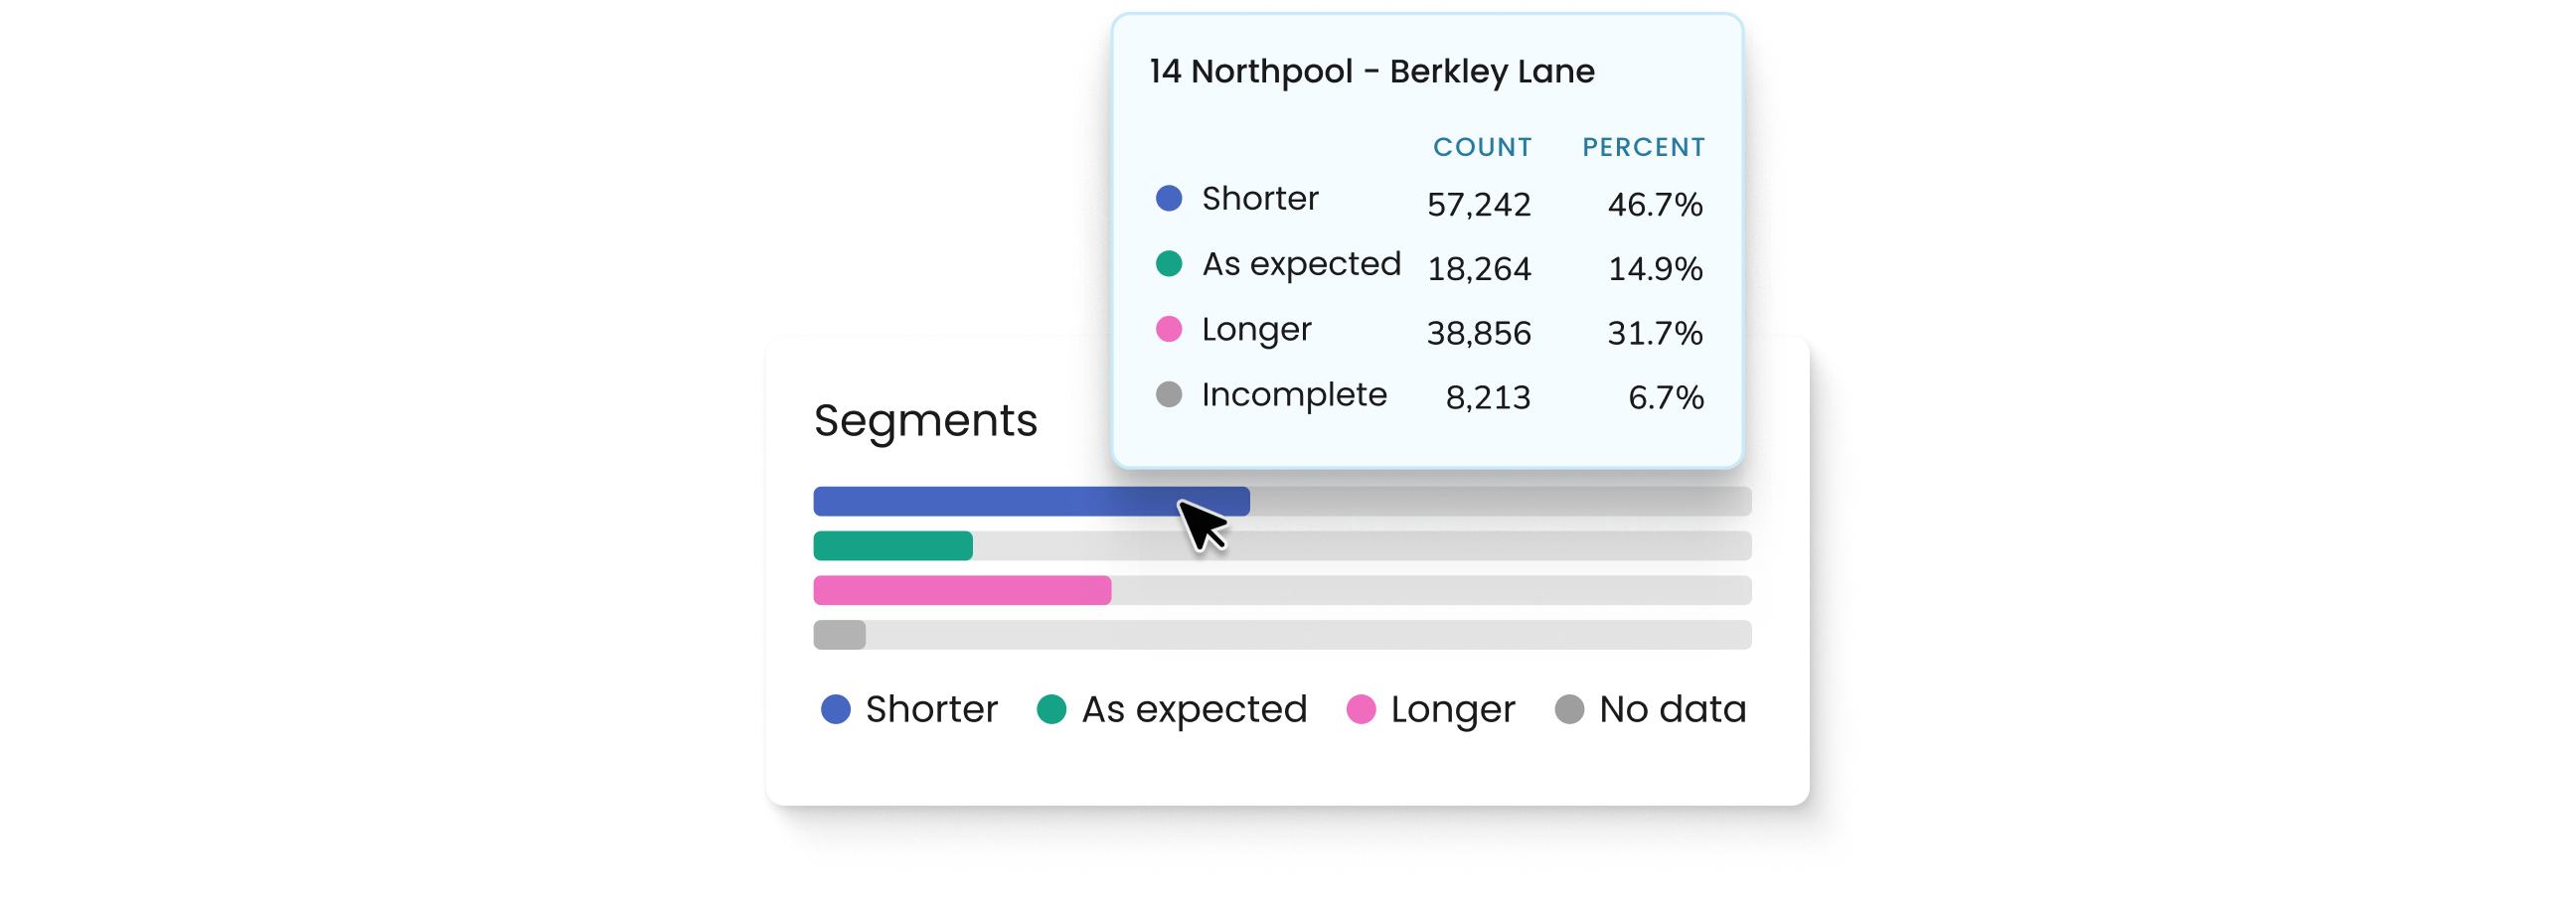
Hovering over the chart will show a tooltip with additional information. The content within the tooltip provides both the count and percentage of all segments within the service that were shorter, as expected, longer or had no data.
If a vehicle is not detected at the first and/or last stop for a segment the data is considered missing and is given the label, no data. The proportion of all segments within the selected service with no data is provided for visibility.
Within the Services page it is also possible to order the list of services by those with the largest or smallest proportion of segments that ran shorter, as expected, longer and no data using the buttons within the column header.