
Mosaiq’s Running times page shows how actual journey and segment durations compare to the schedule.
It highlights where trips run shorter or longer than expected, helping schedulers refine timetables, adjust dwell times, and assess whether the peak vehicle requirement (PVR) is well aligned. This supports greater efficiency and vehicle optimisation during peak periods.
Each stop also displays on-time performance indicators – showing whether a trip arrived early, on time, or late – giving schedulers richer context alongside the running times data.
Running times can be viewed in either a Table view (1) or Chart view (2). These pages show the same data but present it differently.
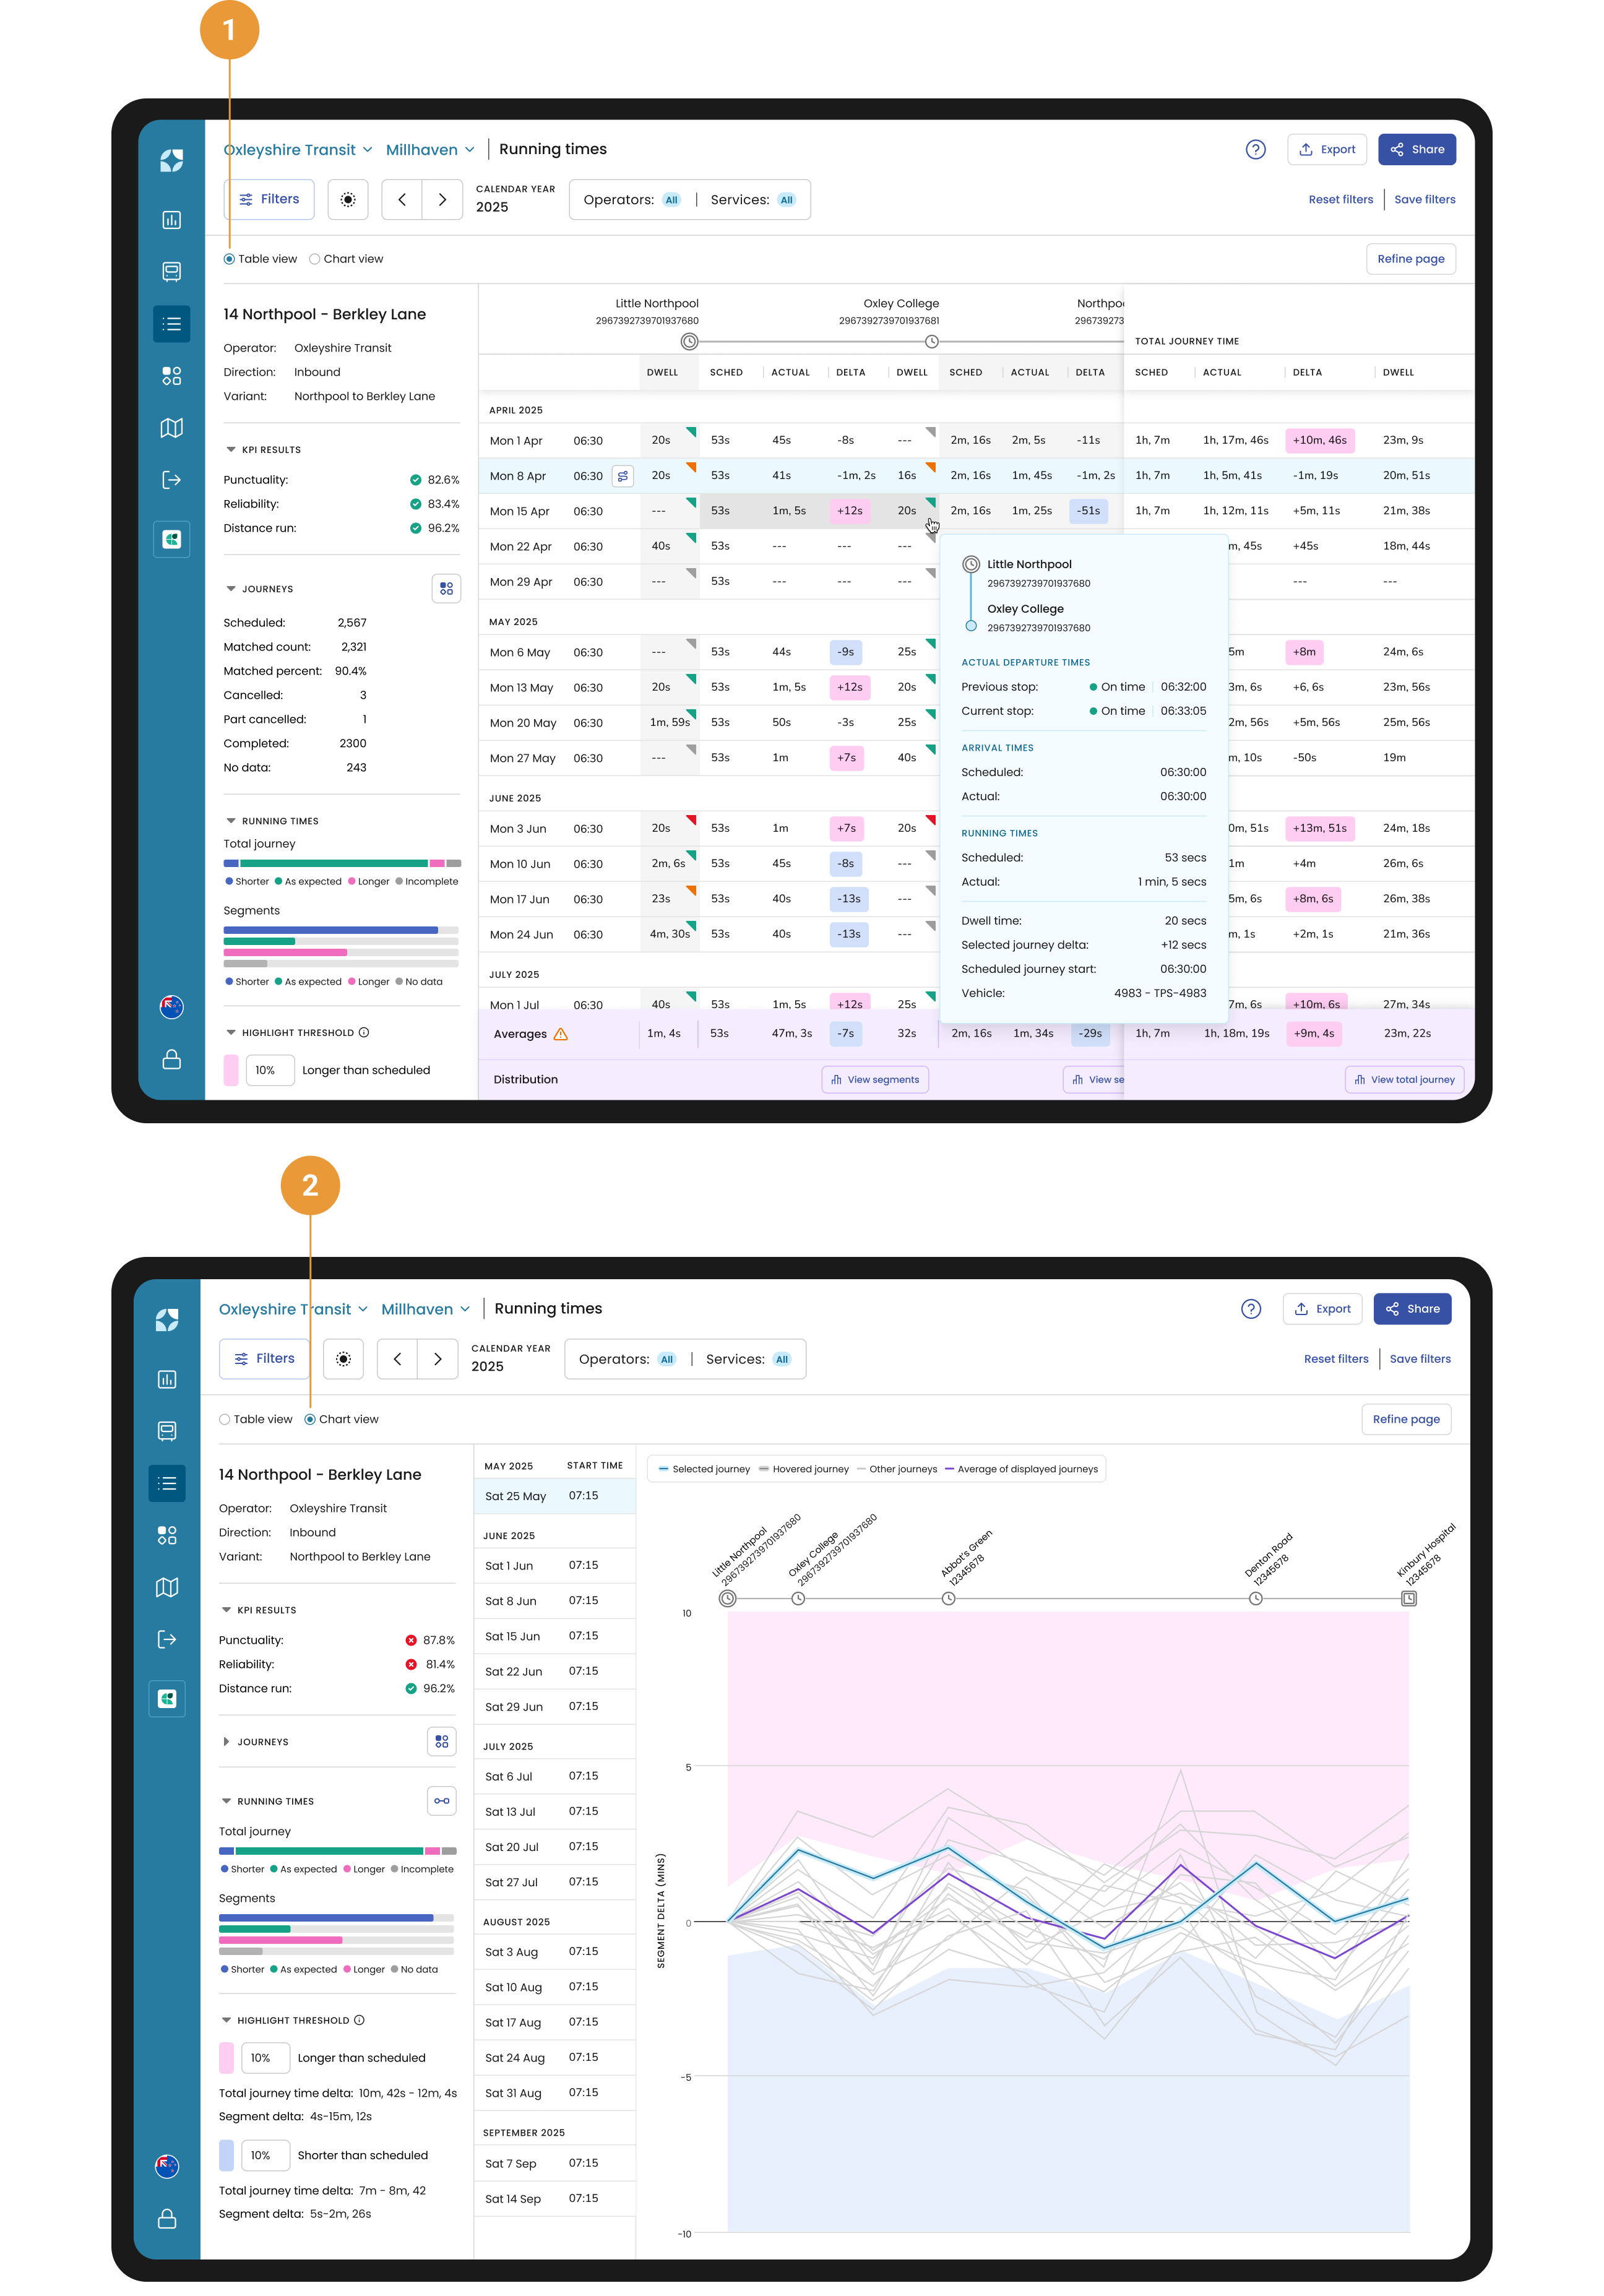
When exclusions have been applied for a particular day/date(s) these will not be displayed in either the Table or Chart view.
Navigation
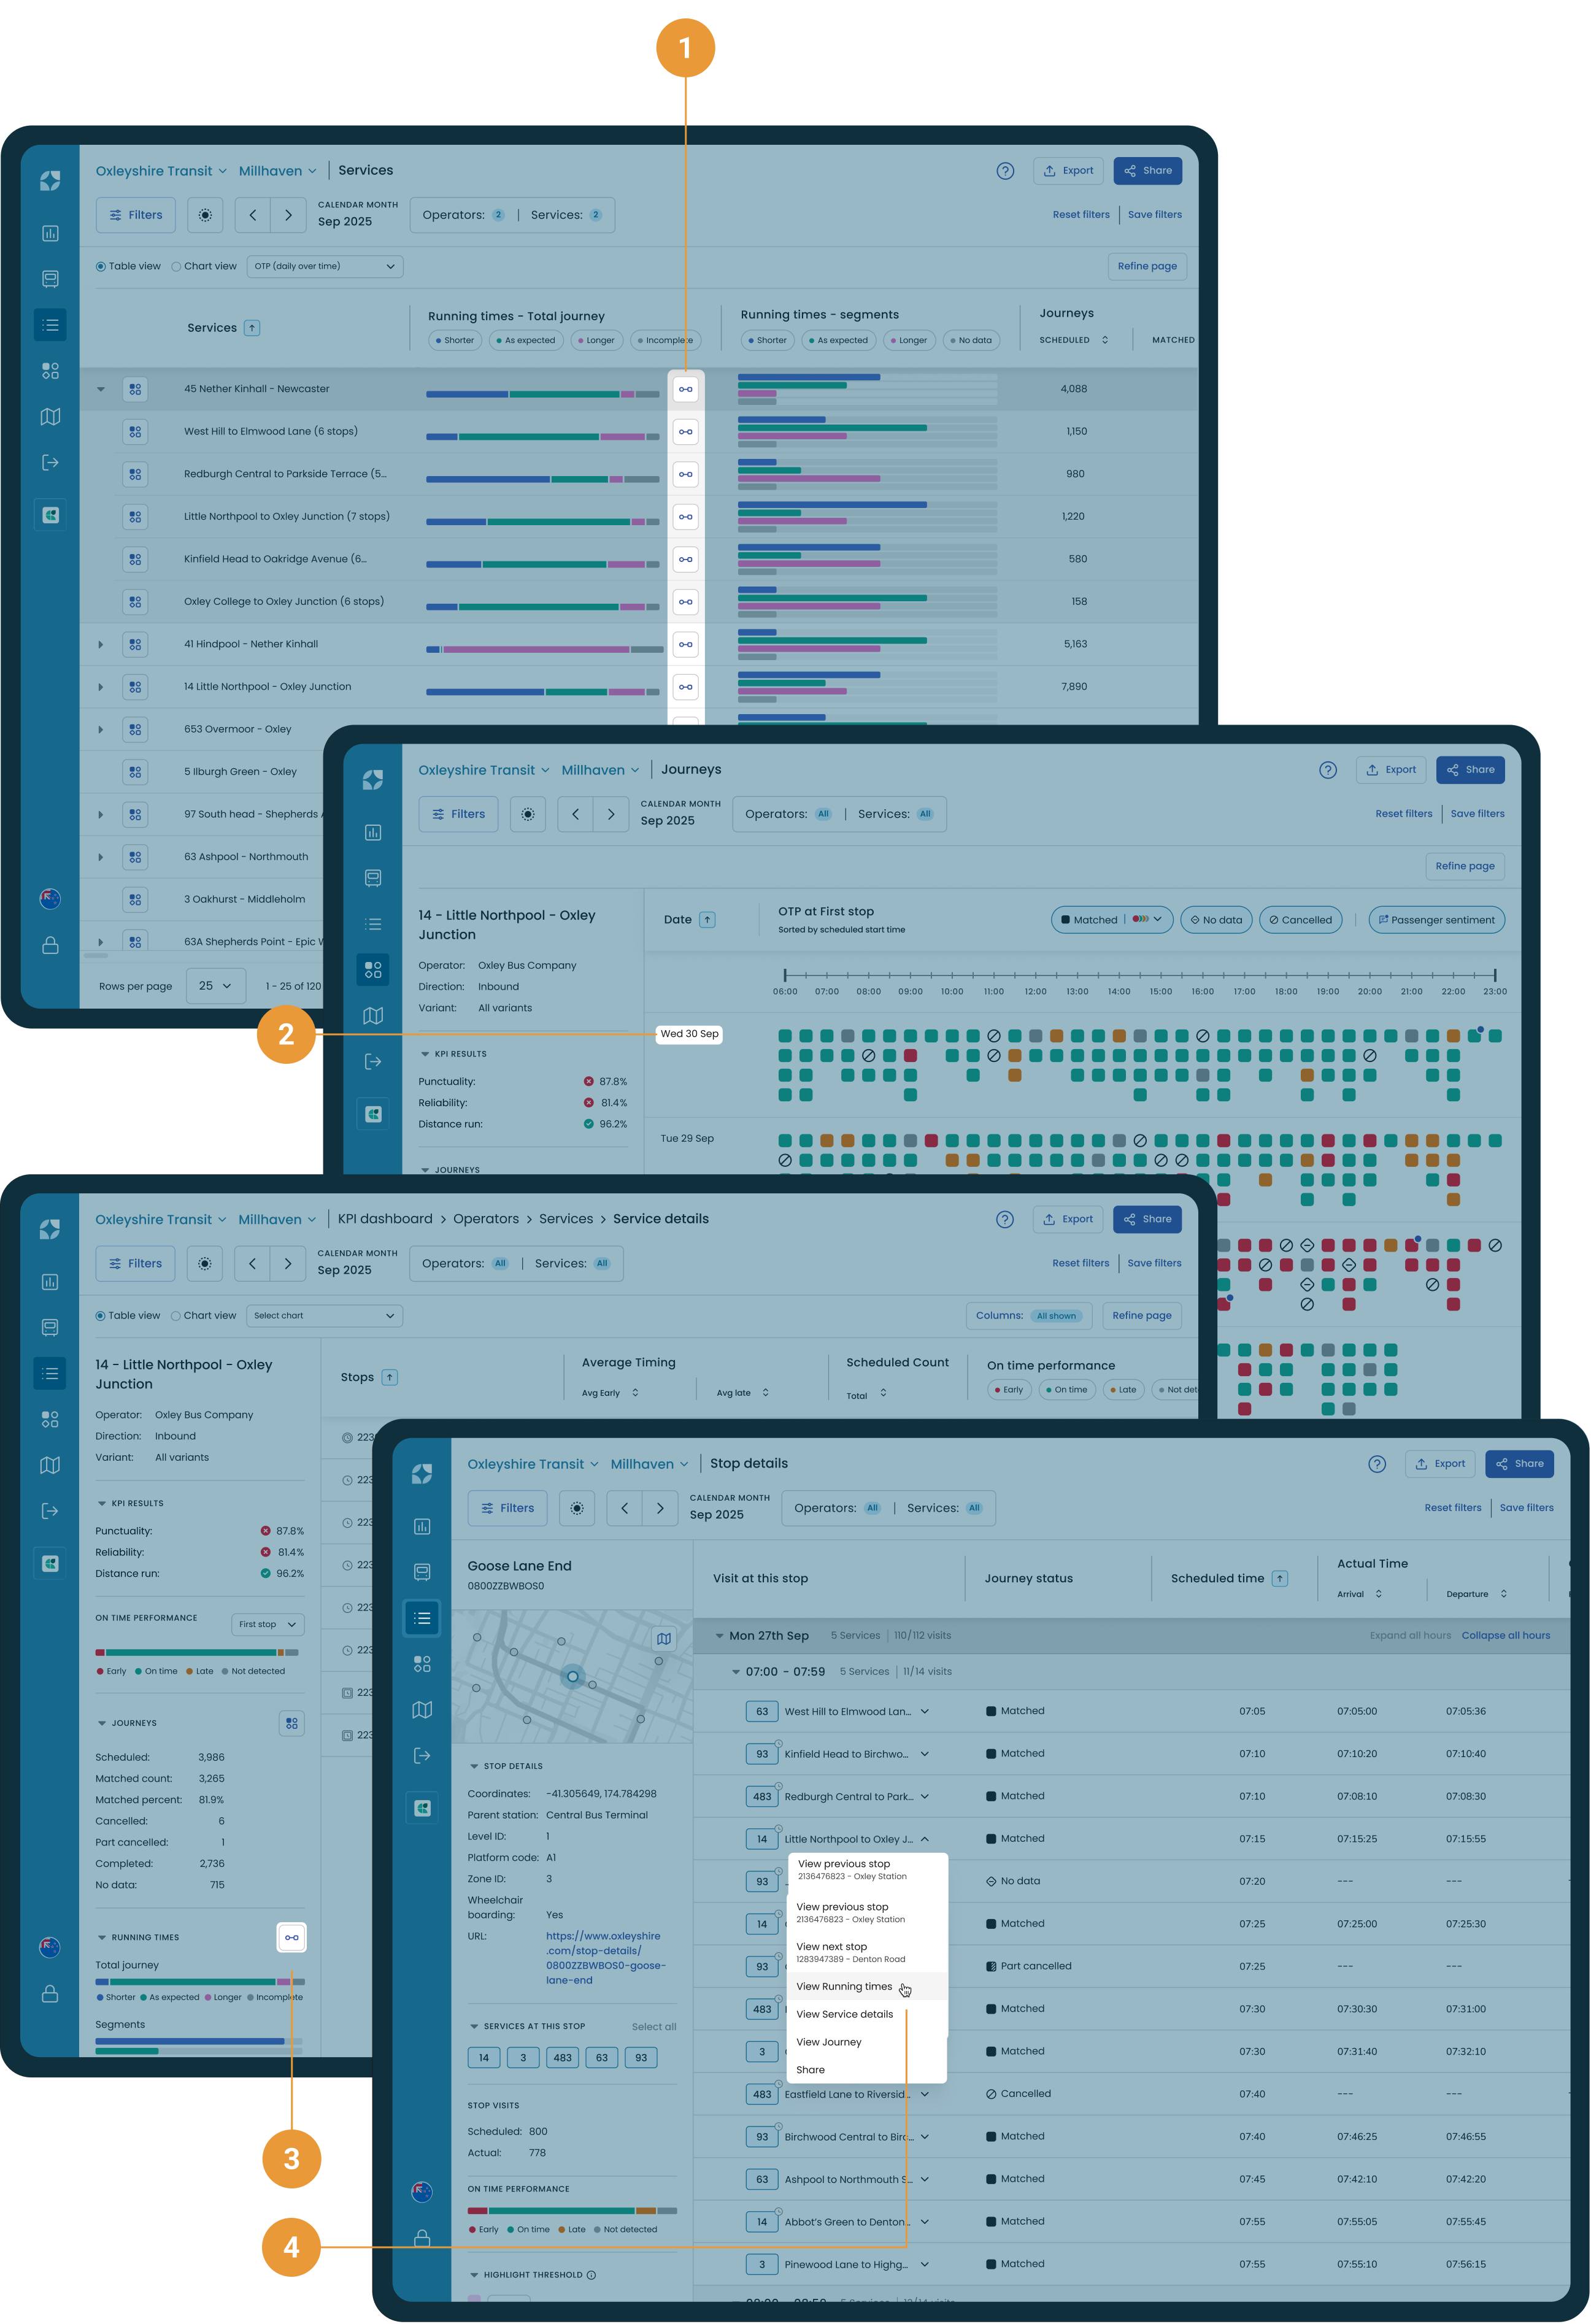
The running time view can be accessed from:
-
Services screen through the buttons in the column for “Running times - total journey” (1)
-
Journeys screen when selecting a date (2)
-
Service details in the side bar (3)
-
Stop details when selecting a visit dropdown (4)
From Running times, the Journey view can also be accessed by selecting the arrow next to the Scheduled journey start (located in the first column).
Stops header
The stops header, shown above both the Table or Chart view, provides the Stop name and Stop ID for each stop and timing point on a journey. Hovering over a cell within the Table view or a portion of the Chart view will highlight the segment that the table or chart is referencing.
Segment is defined as a portion of a trip for running time assessment and could represent either a stop to stop, a timing point to timing point, or from a previous timing point to the current stop.
A unique icon is shown below each stop name/ID to represent the type of stop:
-
First stop - the first stop of the journey and a timing point (1)
-
Timing point - a stop during a journey that is a timing point and not a first/last stop (2)
-
Stop and timing point - a stop during a journey that can be both a stop and timing point for different trips (3)
-
Stop - a stop during a journey that is not a timing point, first or last stop (4)
-
Last stop - the last stop of a journey and a timing point (5)
To show all stops click on the Filters button > All stops > View running times. Similarly, show timing points only by selecting “Timing points only”.
Refine page button
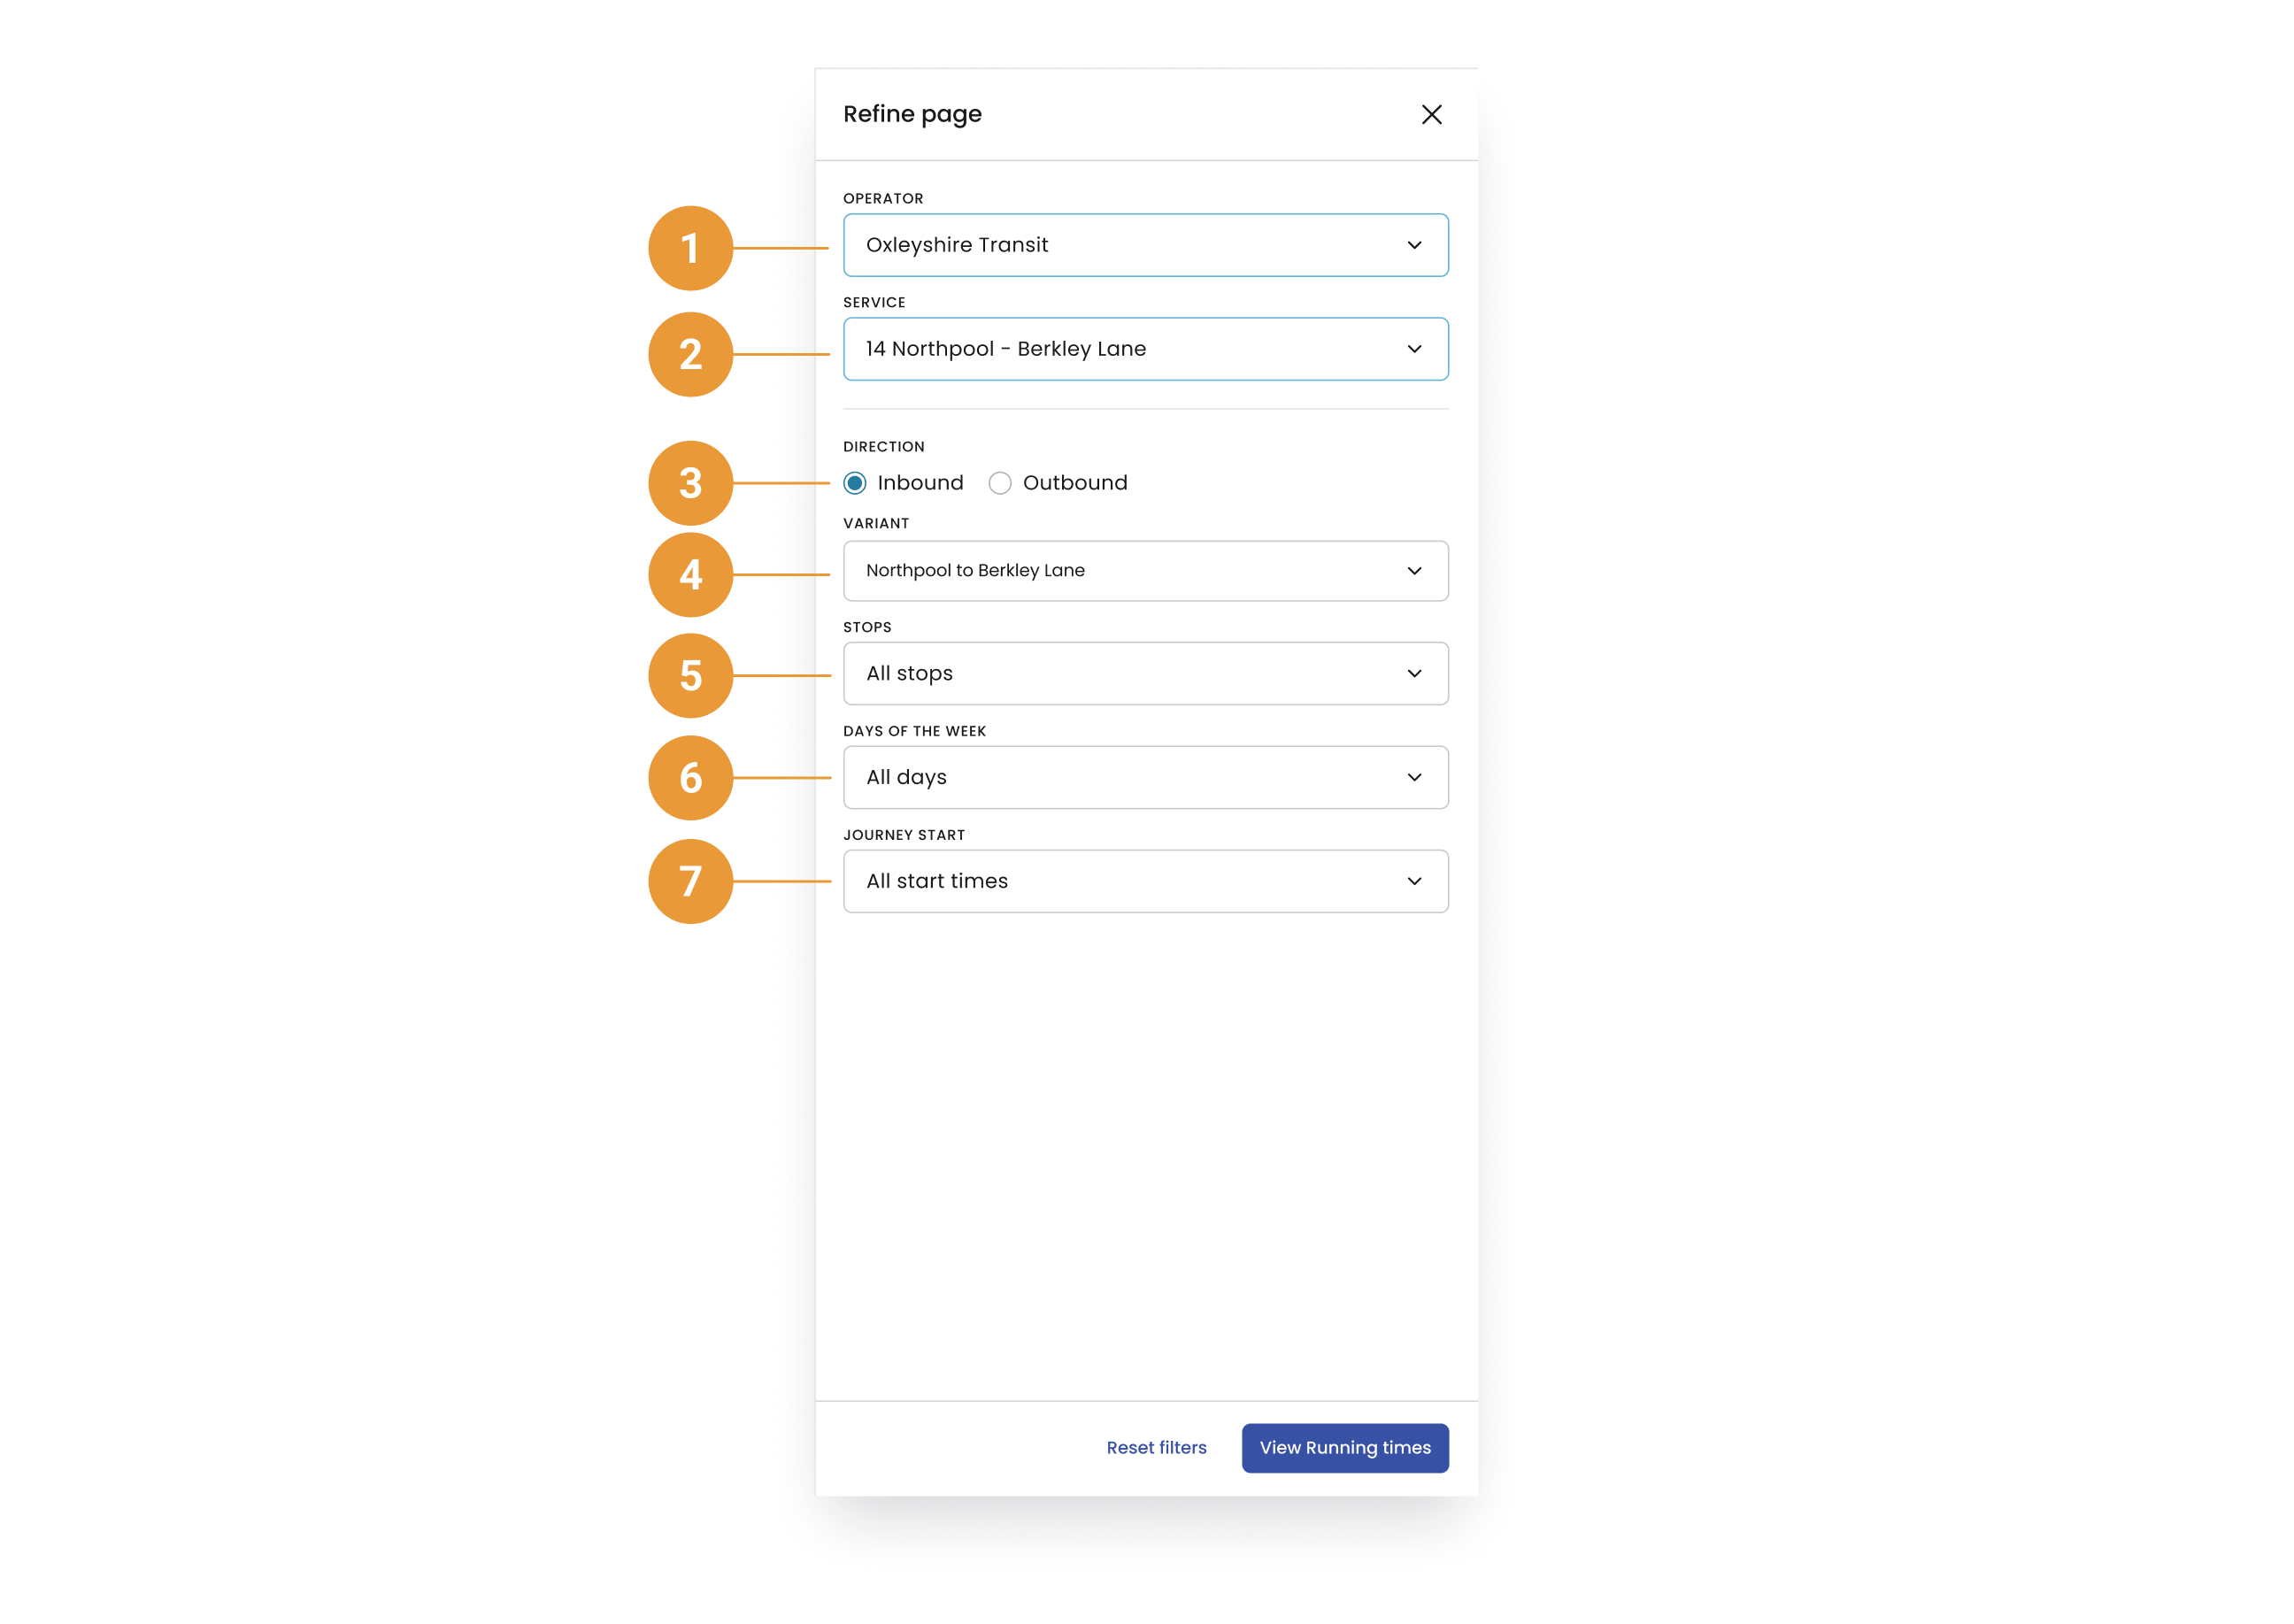
The refine page button applies to both the Table and Chart views, and gives control over:
-
Operator (1)
-
Service (2)
-
Direction of the journeys (3)
-
Which variant is to be analysed (4)
-
If all stops or timing points are shown (5)
-
Which day/s of the week are shown (6)
-
Given the direction/variant/day of week choices which Journey start times are shown (7)
The operator / service fields will automatically be populated with the value from the page you have drilled down from. These fields enable you to quickly view the running times of a different service’s set of variants.
Any selection of operators and/or services from within the filter hub will influence what operators / services are available to be selected from within the Refine page panel.
Highlight thresholds
Highlight thresholds are user-defined fields that apply a colour treatment to assist in finding patterns for longer or shorter running times. Refer to Highlight thresholds for more information on how these are applied.