
Running times - Table view provides a detailed view of vehicle adherence to the schedule. It enables users to view performance at each stop, between timing points only, and the total journey.
Scheduled, Actual, Delta, Dwell columns
e
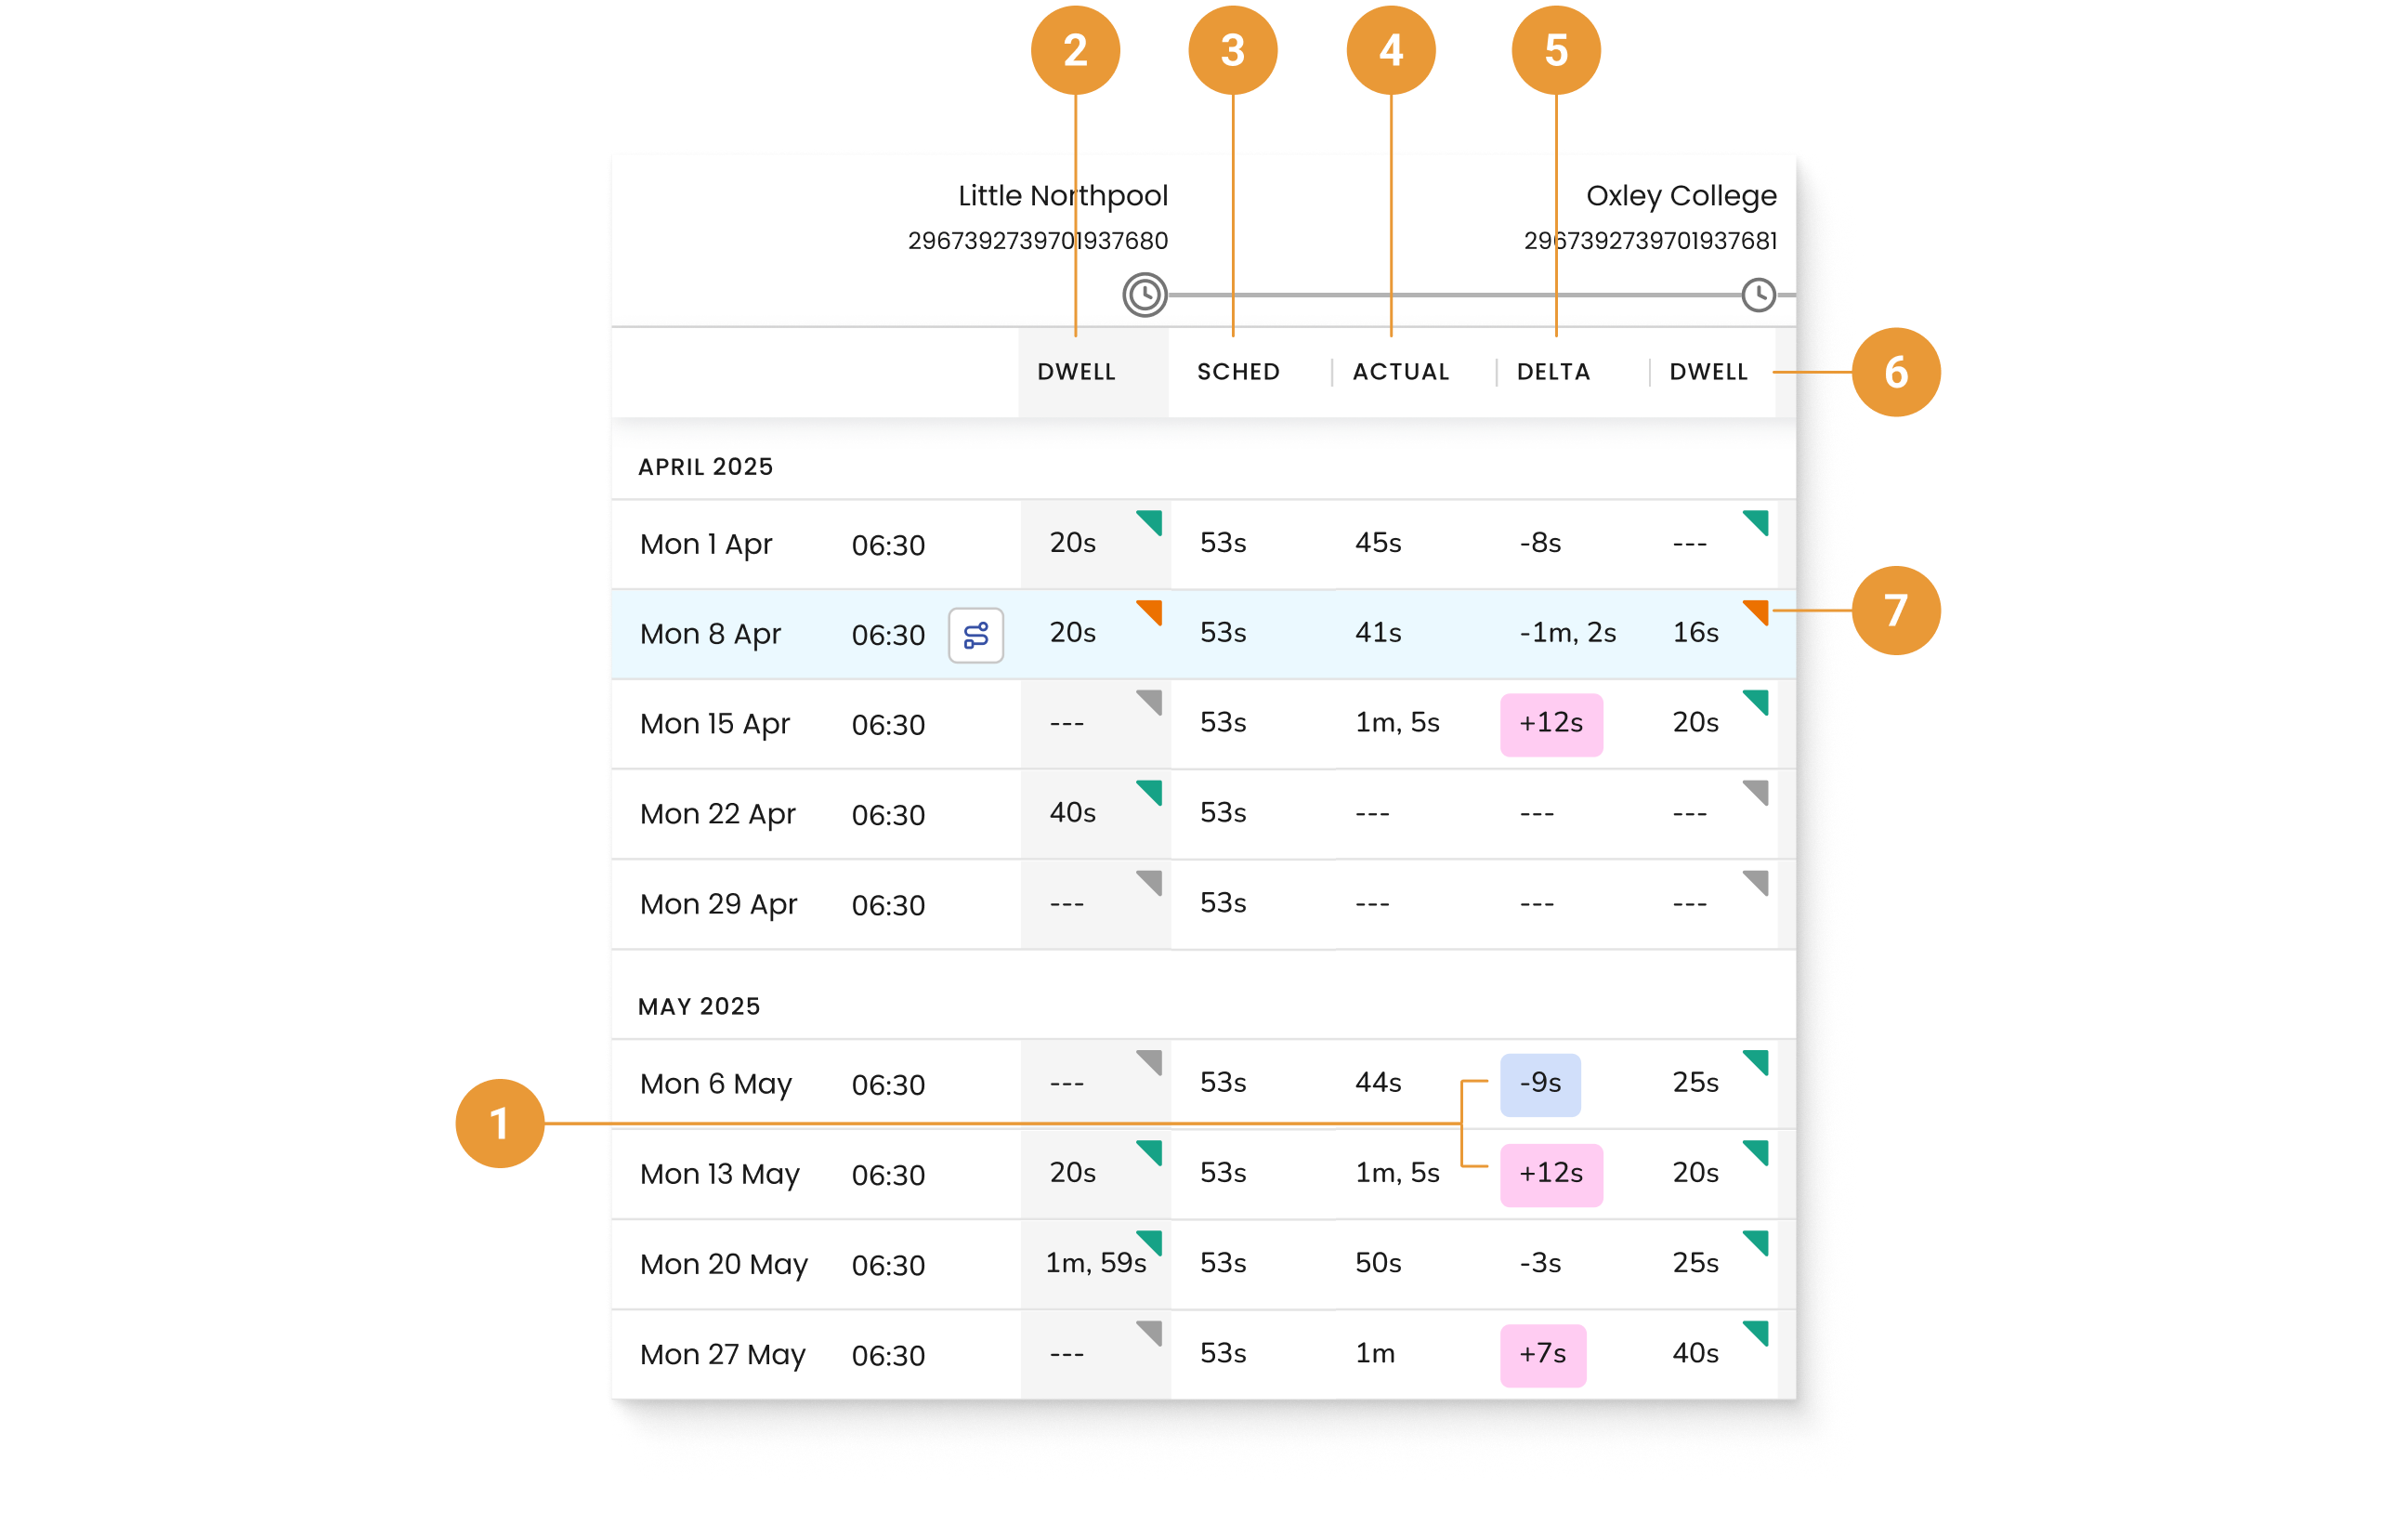
In the Table view, highlight thresholds are applied to the Delta column (1) to represent longer or shorter running times based on a user-defined threshold percentage.
First stop dwell time - Measured from when the trip has started until it departs from the first stop. (2)
Scheduled running time - The scheduled time range from the departure of one stop to the departure of the next stop. (3)
Some schedules use whole minutes only, which can lead to segments being allocated 0 minutes as a scheduled running time. Mosaiq detects these 0 minute segments and shows an alert when they are present.
Actual running time - The actual time range between the departure from one stop and the departure from the next stop, including dwell time at the stop. The difference between the Actual departure from previous timing point and Actual departure from current stop. (4)
Delta - The time difference between scheduled and actual travel times. (5)
Dwell time - The time of arrival until departure at the current stop. (6)
Dwell time at the last stop will always be N/A (not applicable).
In the event that any segment of the journey lacks available data, it will be marked with the designation “---” to indicate its absence.
On-time performance - Shows whether each destination stop was, early, on time or late. (7)
Total journey time
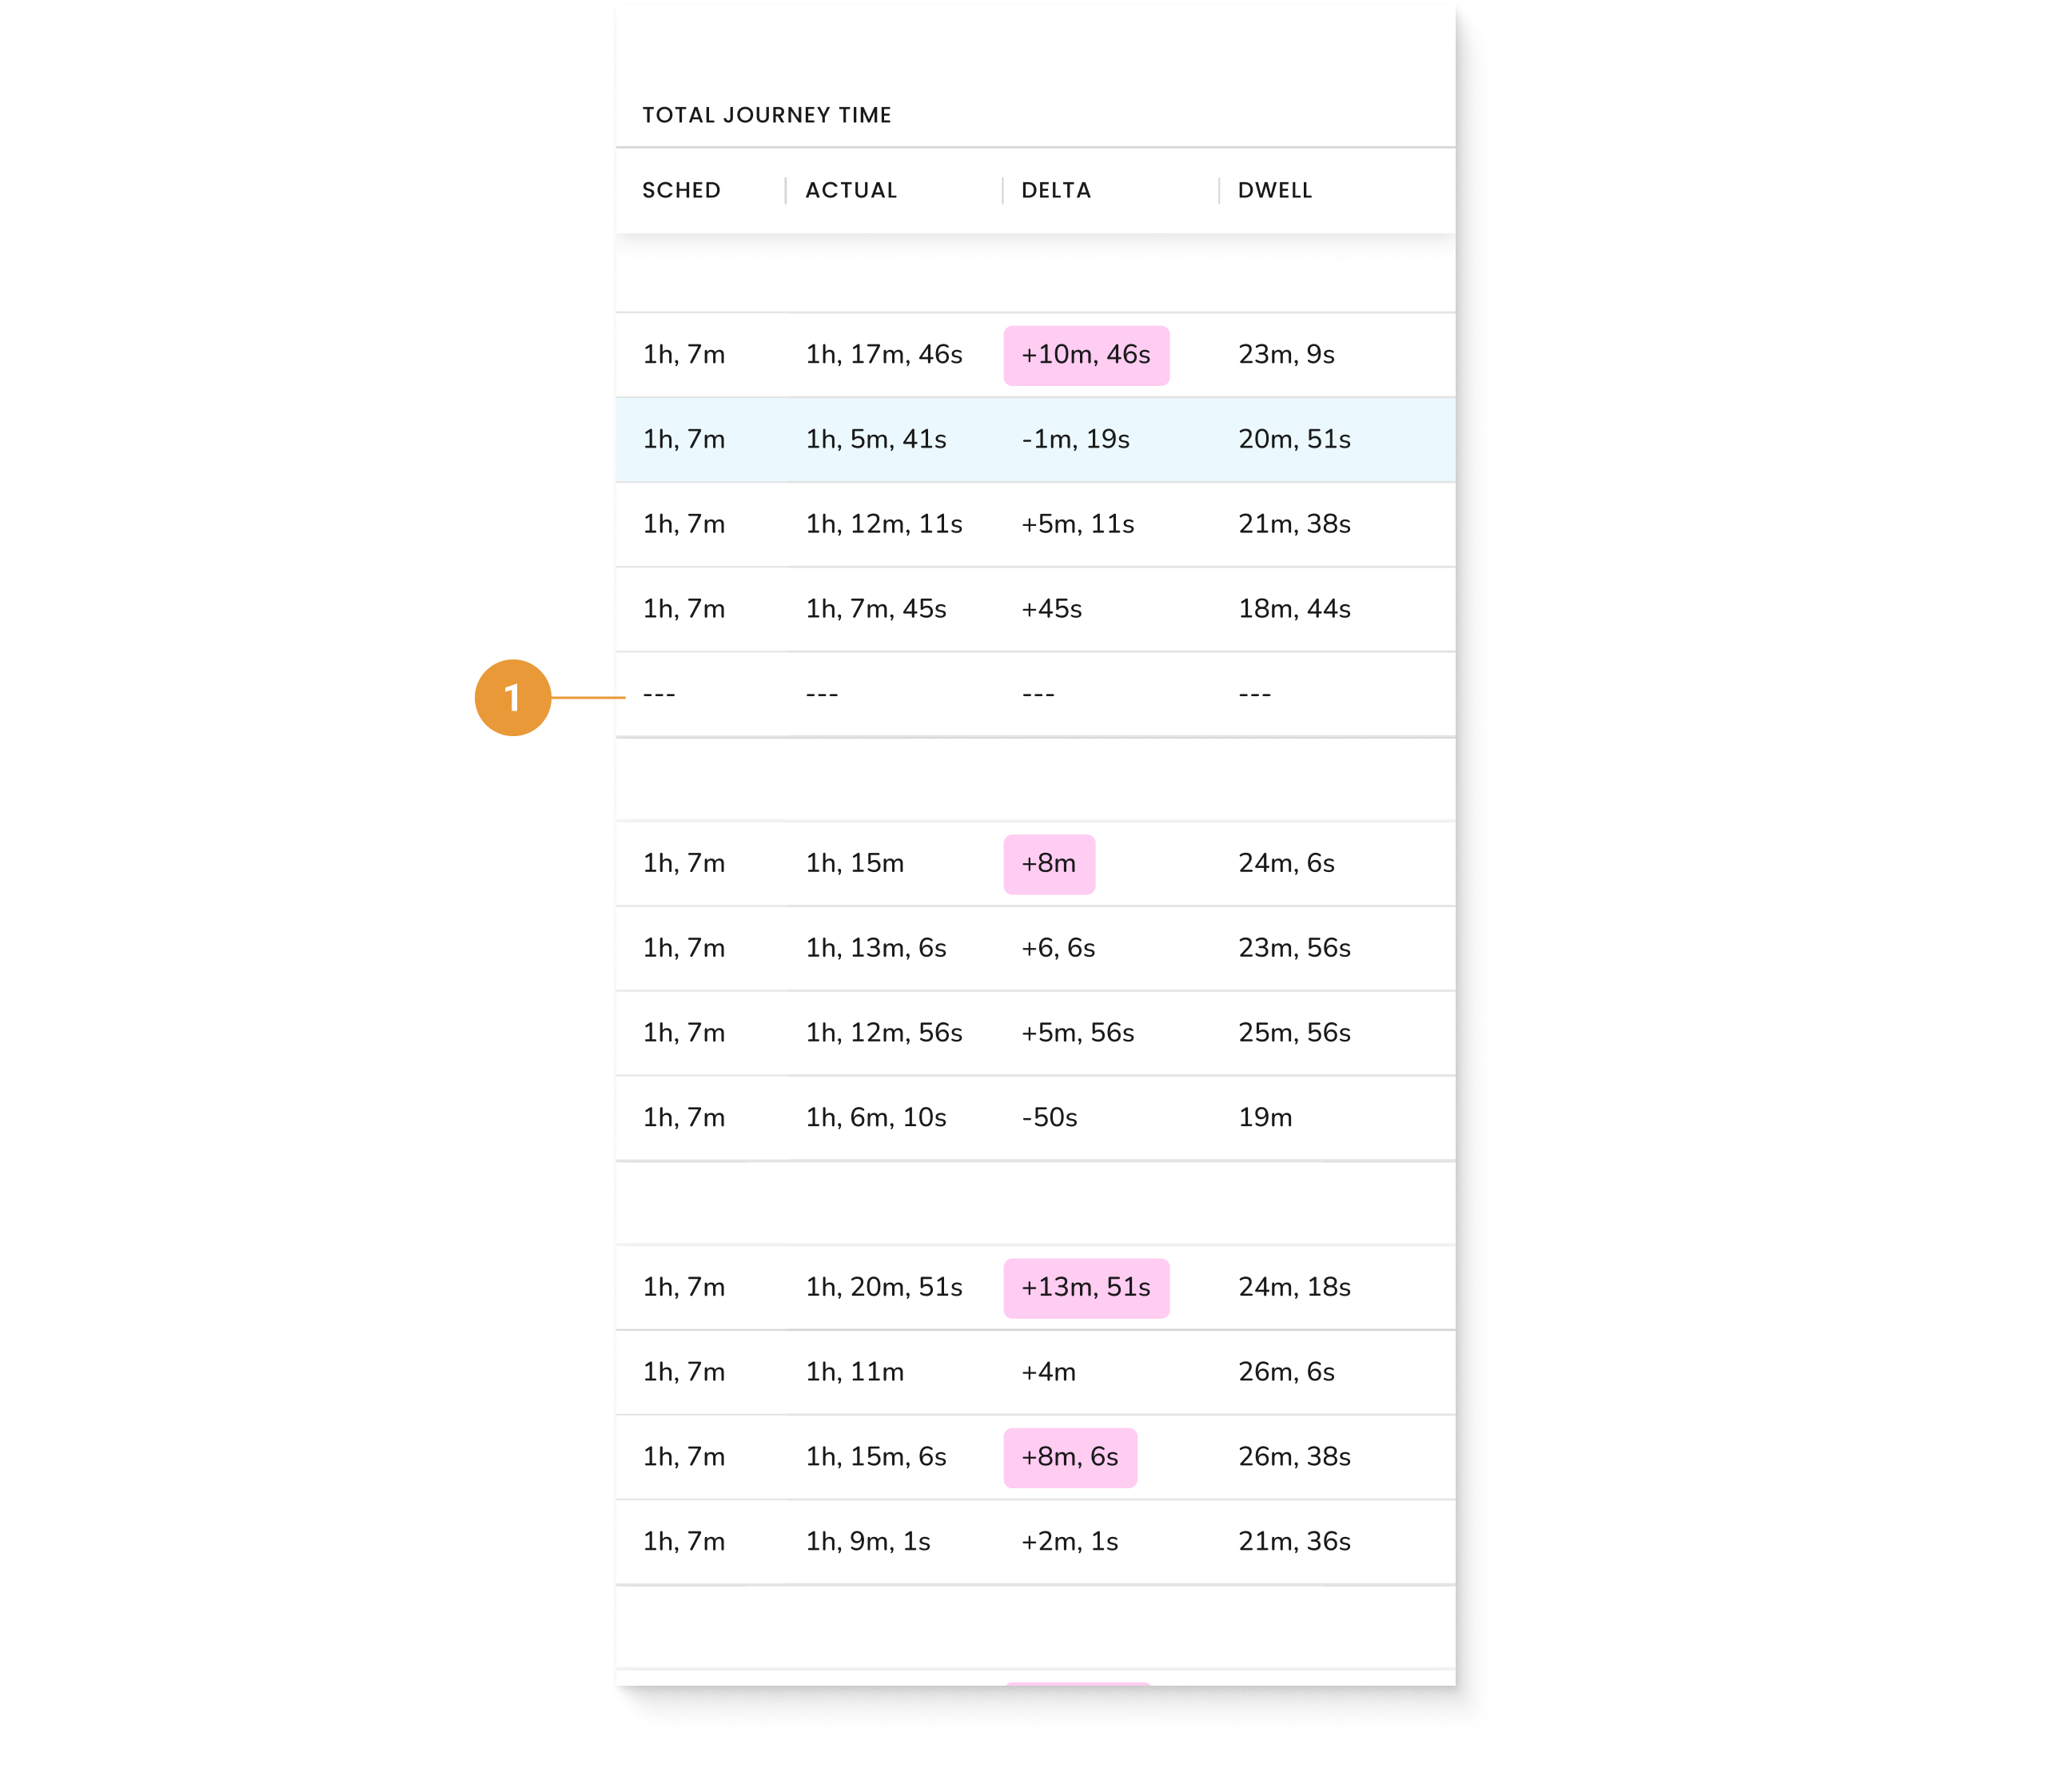
The total journey time panel is available in the Table view only and shows the total schedule time, actual time, delta and dwell for that journey. No data will be available (displayed as “---”) for actual time, delta and dwell time for incomplete journeys (1). The highlight also corresponds to what is selected in the sidebar for highlight thresholds.
Incomplete journeys are those where the first and/or last stop of a journey has not been observed or detected.The total journey time aggregates all dwell times, excluding the first and last stop.
If the first stop is required to be added to the total dwell time aggregation the export function can be used for custom reporting.
Averages row
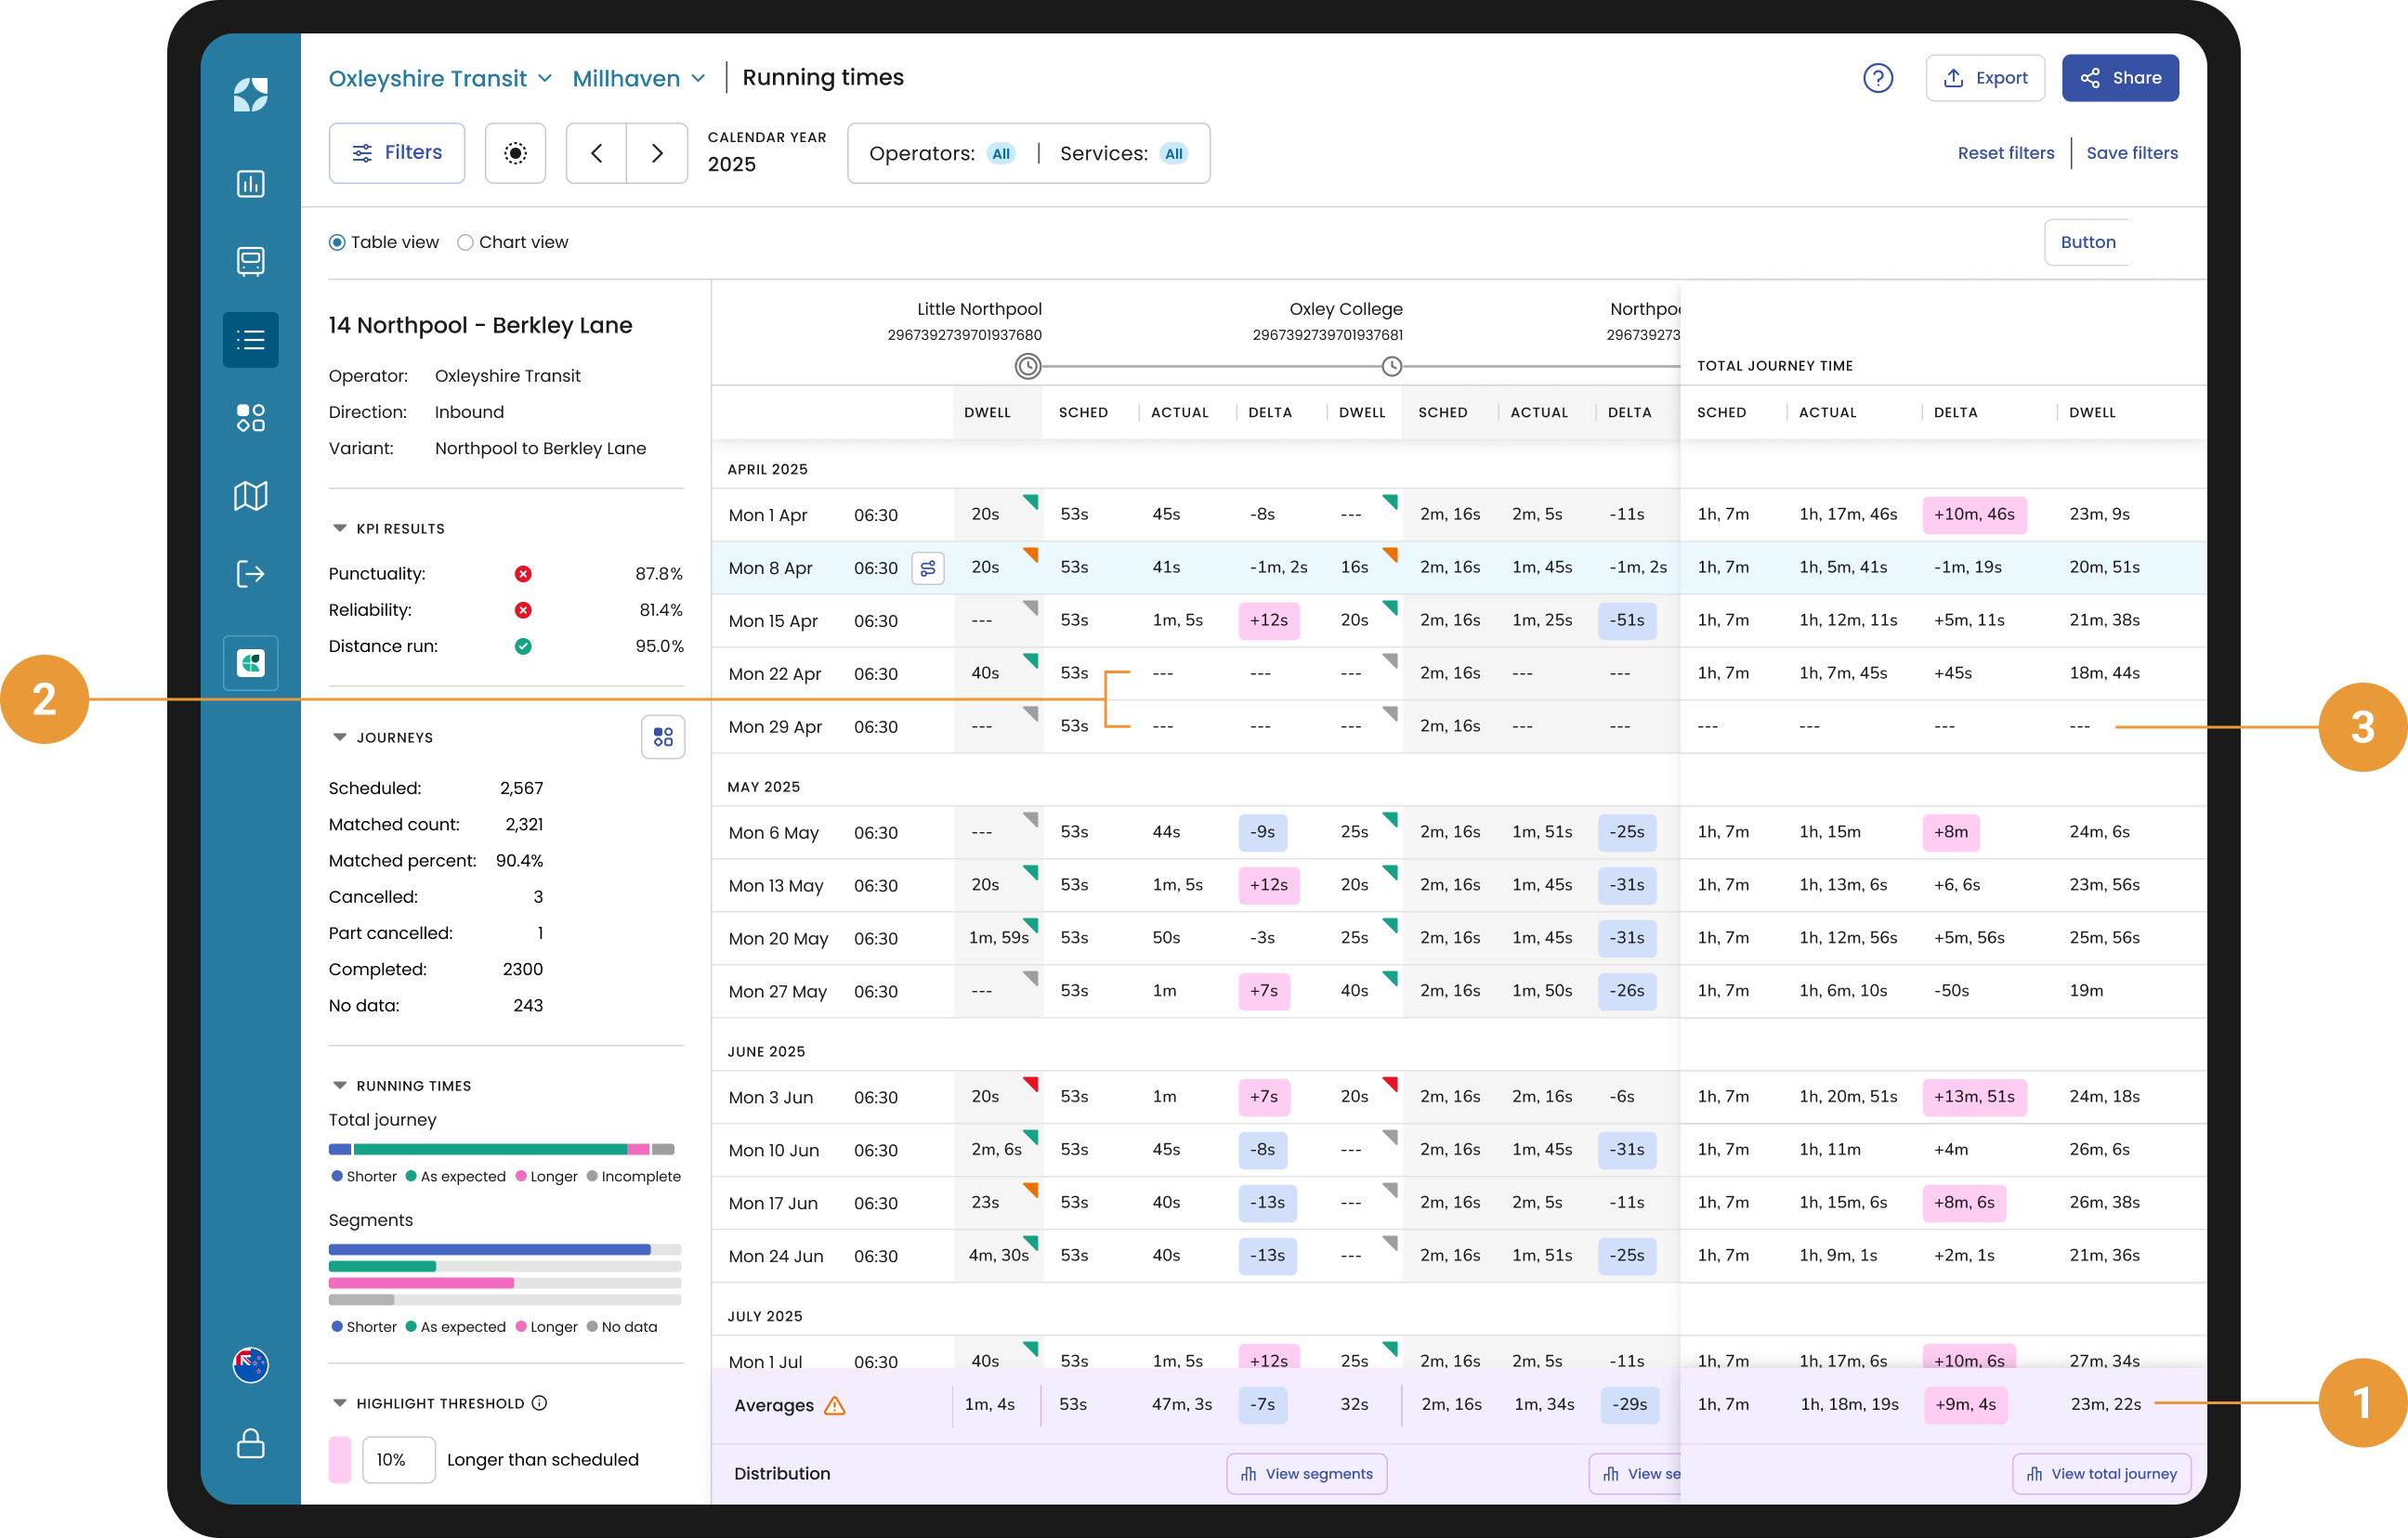
The averages row is available at the bottom of the Table view (1) which shows the average (or mean), actual duration, delta and dwell for all selected journeys. It enables users to view the average performance of all selected journeys for either particular segments or the total journey.
The average is calculated from all completed segments or journeys. In other words, segment averages exclude segments with no data (“---”) (2), and excludes incomplete journeys (3).
No data could indicate either missing information, that a service is not available or an error in data collection. For more information click here.Completed journeys are those where both the first and last stop have been observed or detected.In some cases your selected journeys may have different total scheduled durations. When the journeys selected have different scheduled durations:
-
A range of values for the scheduled duration will be shown in the averages row for both the segment and total journey columns. In particular, the range will identify the scheduled duration for the shortest journey selected and the longest journey selected.
-
The delta values will not be highlighted due to not having a singular reference point to apply the threshold against.
Distribution
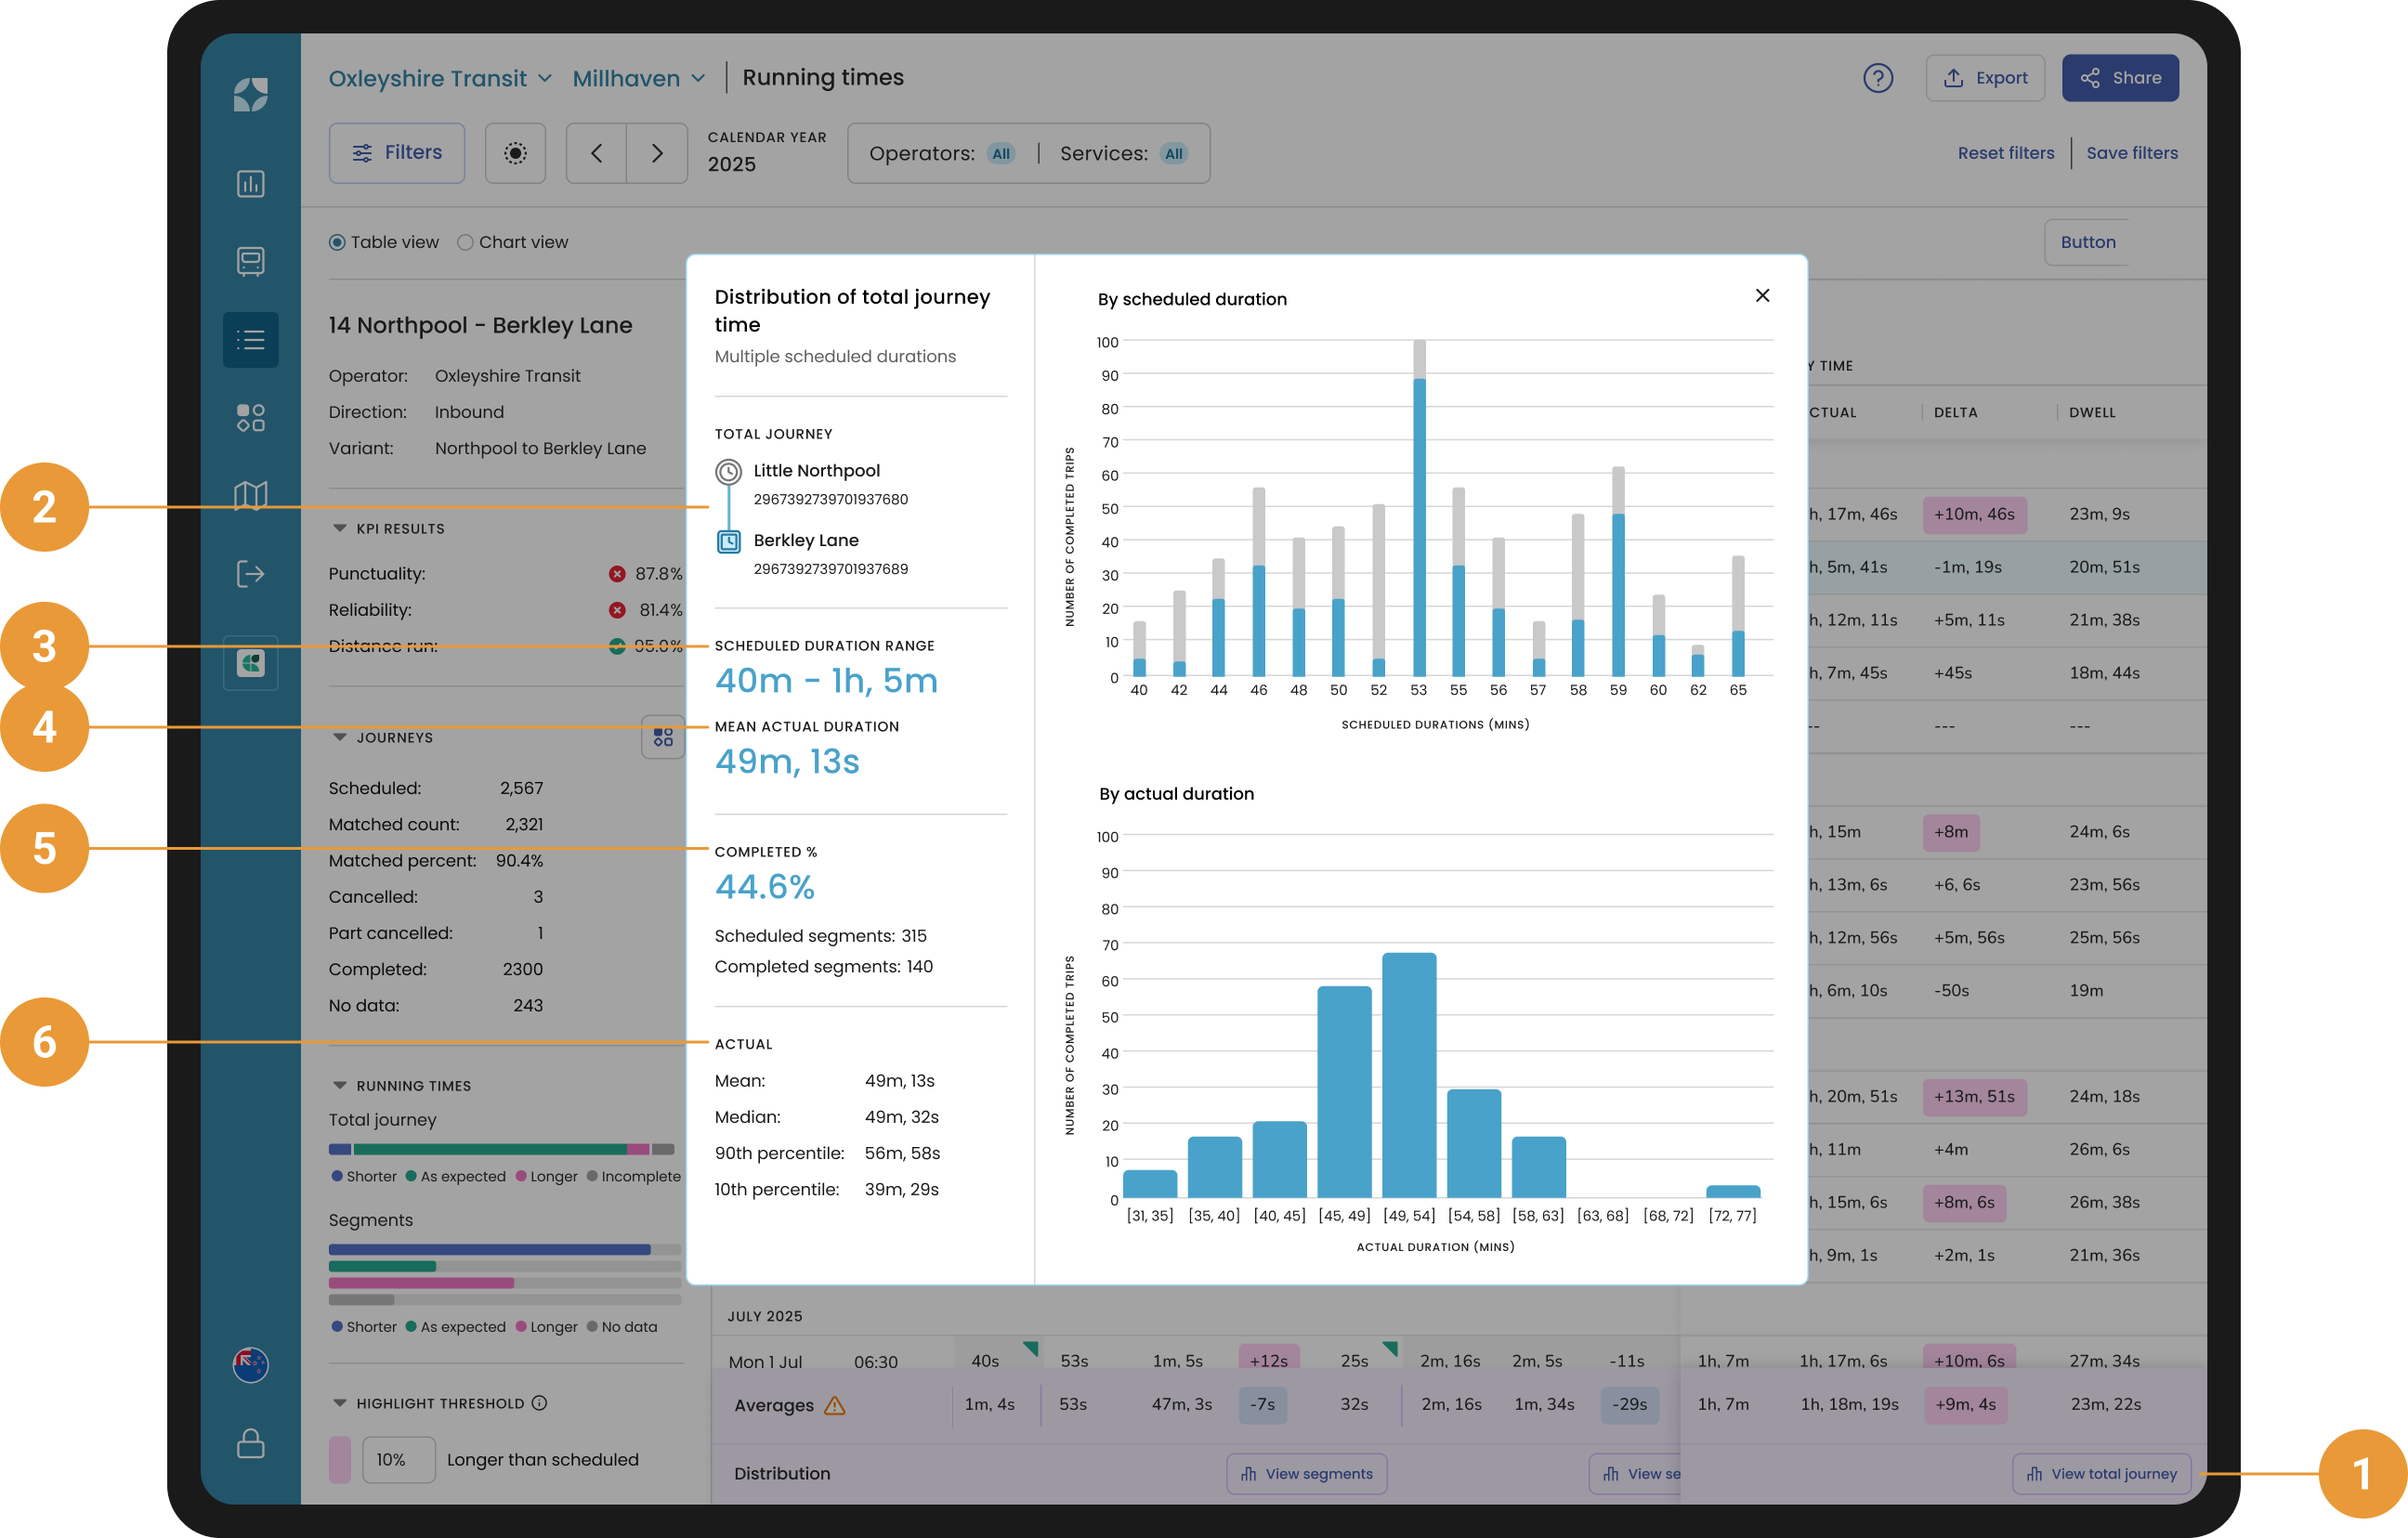
The running time distribution charts for actual segment and total journey duration are accessible by clicking either the “View segment” or “View total journey” buttons within the distribution row (1).
Clicking these buttons will show the following information.
In the side panel:
-
Total journey / Segment - The first and last stop in the total journey, or the start and end stops for the segment (2)
-
Scheduled duration range / Scheduled duration - The scheduled duration of the segment or total journey for all selected journeys. Similar to the averages row, when your selected journeys have different scheduled durations a range of values will be shown (3)
-
Mean actual duration - The average (mean) actual duration of the segment or total journey for all selected journeys (4)
-
Completed % - The percentage of all selected journeys or segments that were completed. The number of scheduled and completed journeys/segments is also provided (5)
-
Actual - The mean, median, 90th percentile and 10th percentile for the actual duration of the segment or total journey for all selected journeys. The percentiles represent the value at which either 10% or 90% of data points fall at or below the provided value. (6)
Distribution charts:
-
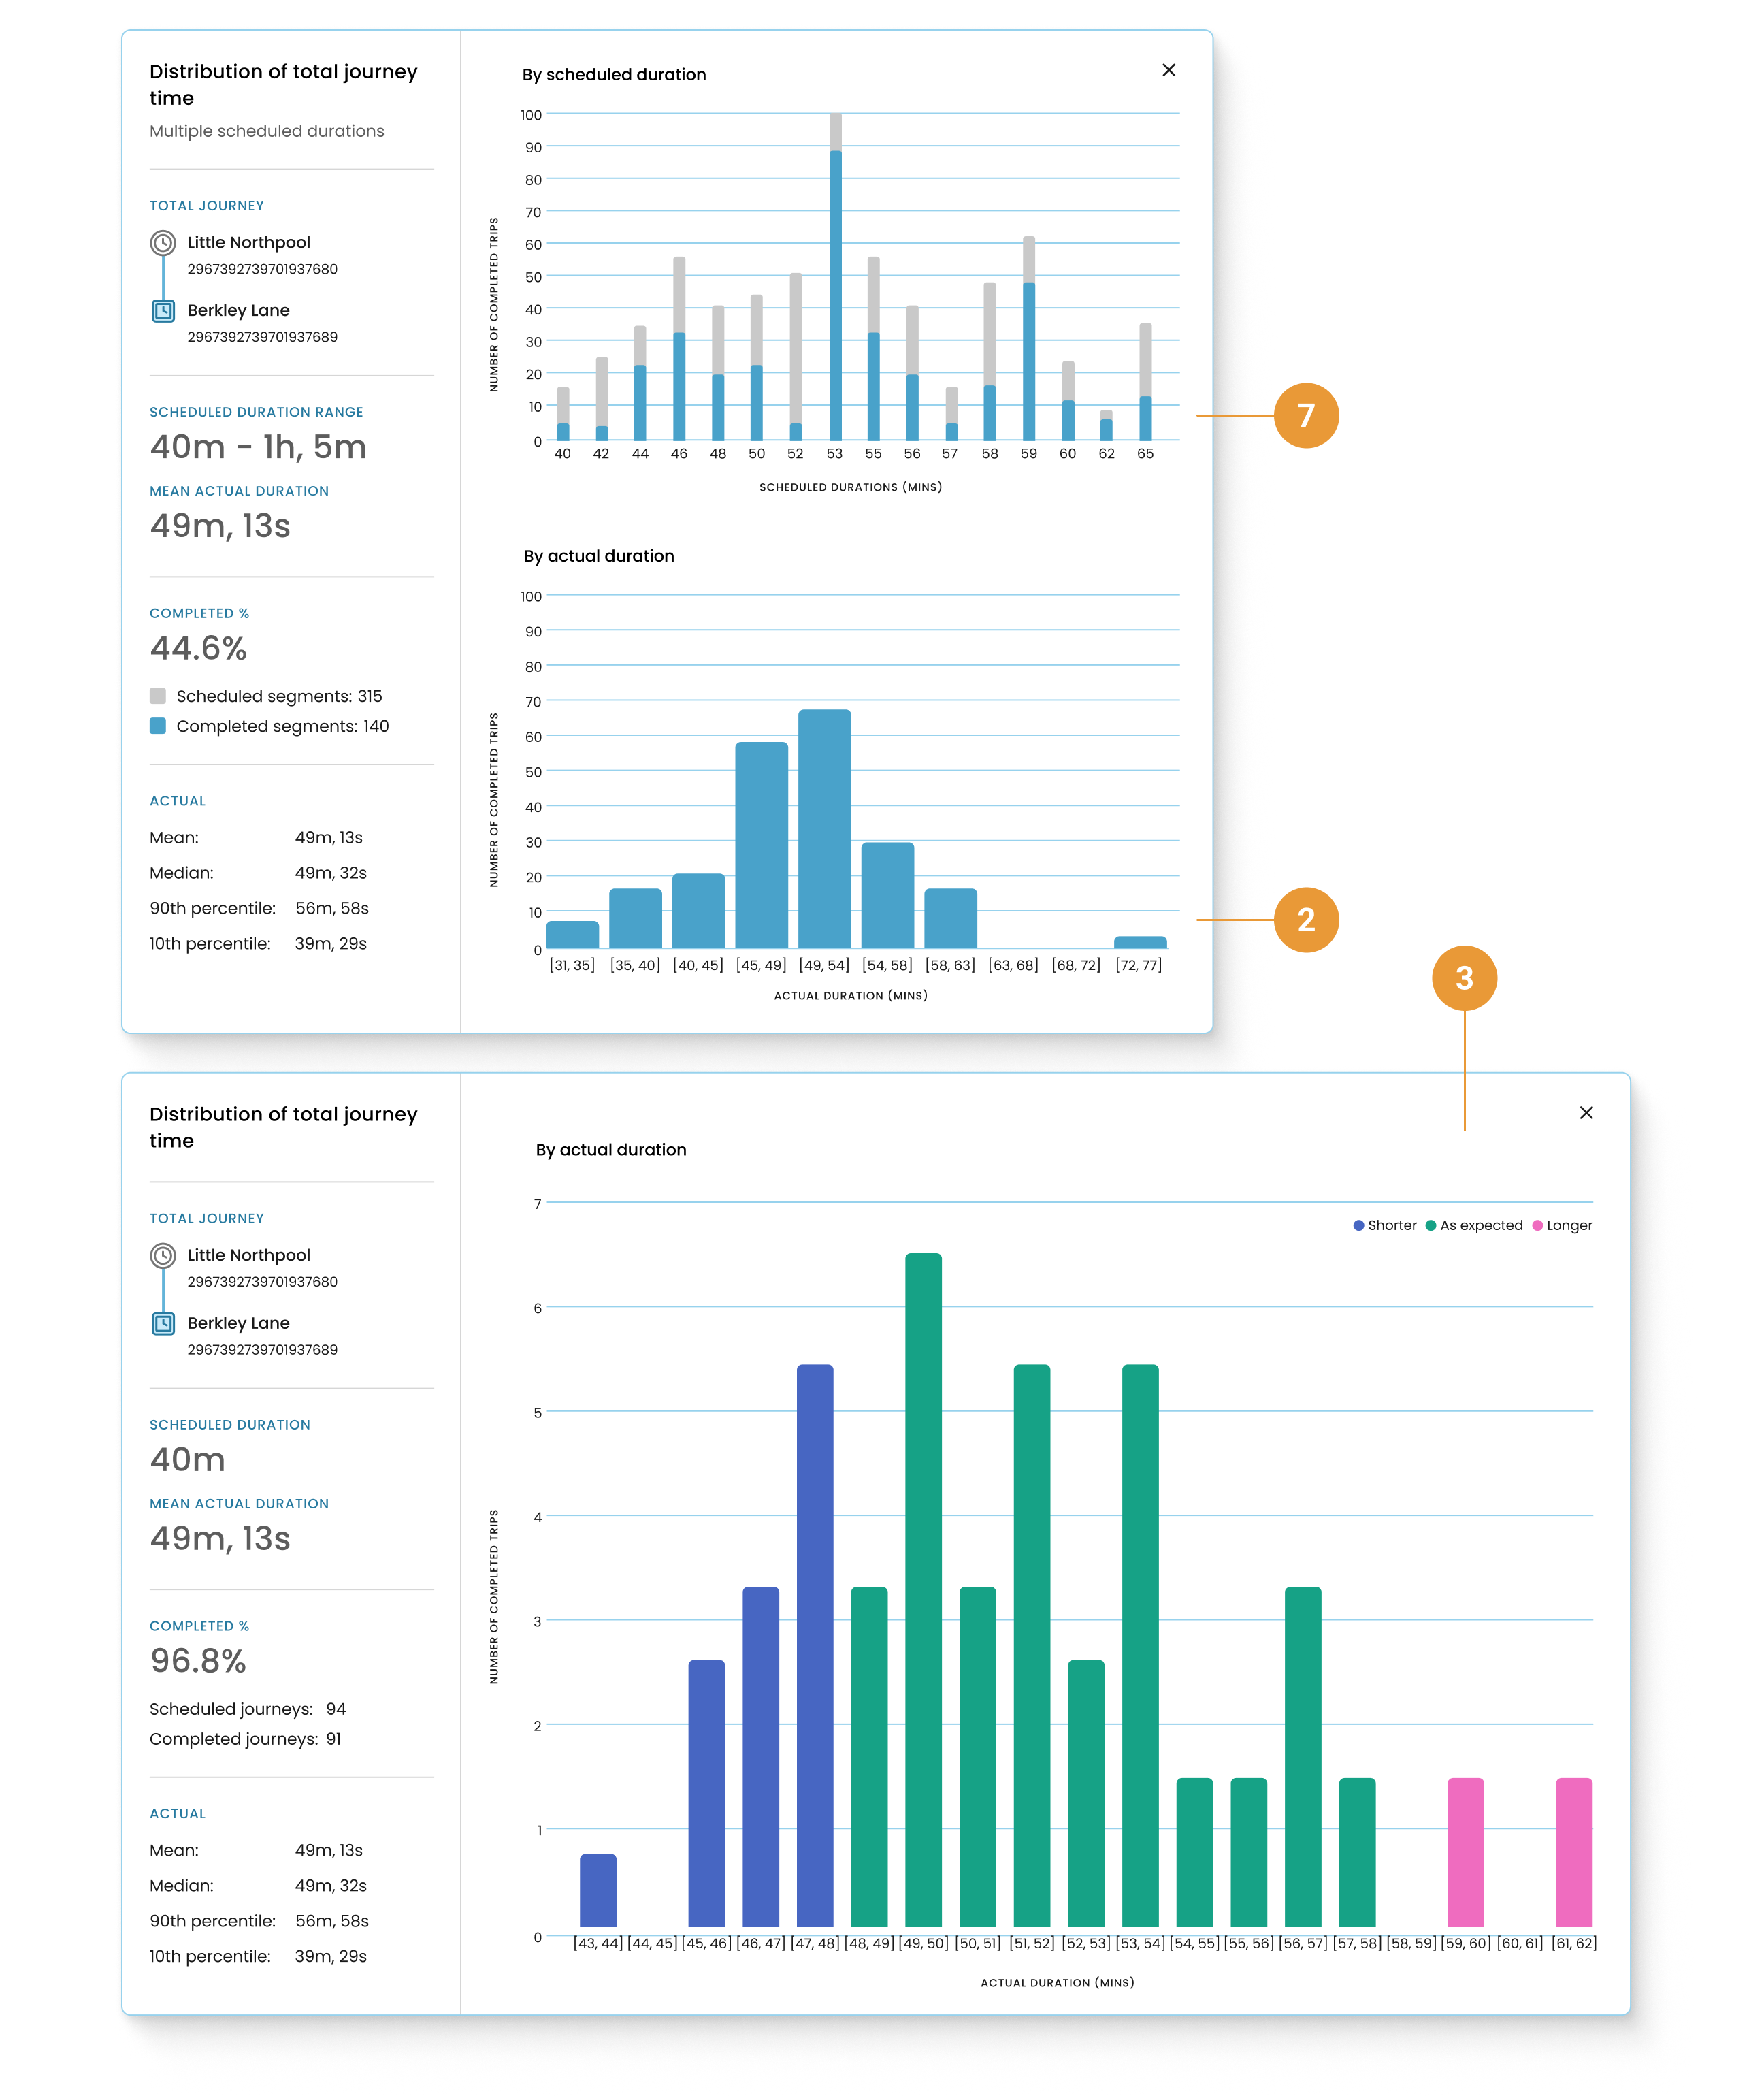
When your selected journeys have many different total scheduled durations two charts will be shown:
-
By scheduled duration - A bar chart showing the number of segments or journeys, grouped by scheduled duration. The chart distinguishes between completed journeys or segments, and those that are scheduled but not complete (7)
-
By actual duration - A histogram displaying the number of completed segments or journeys grouped by actual duration (8)
-
-
When your selected journeys have the same scheduled duration one chart will be shown:
-
By actual duration - A histogram similar to above, however the bars are coloured by whether the actual duration is shorter, longer or as expected (9)
-
Column tooltip

Hovering over columns in the Table view of the main body of the page will show a tooltip with additional information.
The highlight shows what segment of the journey the data is referring to (1).
The content within the tooltip includes the following information relating to the highlighted segment (2):
-
Scheduled stop arrival time - The time scheduled for the vehicle to arrive at the stop.
-
Actual stop arrival time - The time the vehicle arrived at the stop.
-
*Actual departure from previous stop/timing point - Vehicle departure time at the previous stop or timing point. Including on-time performance indicators.
-
Actual departure from current stop - The time the vehicle departed from the highlighted stop. Including on-time performance indicators.
In the case of the last segment “Actual departure from current stop” will always show “Actual arrival at current stop” (regardless of whether the table is displaying all stops or timing points only) as running times are measured as departure-departure for all except the last segment, which is departure-arrival.
-
*Scheduled running time - The scheduled time from the previous stop to current stop.
-
*Actual running time - As described above.
-
Delta - The difference between the Scheduled running time and Actual running time.
-
*Dwell time from previous stop/timing point - The time of arrival until departure at the current stop. The difference between Actual stop arrival time and Actual departure from current stop.
-
Scheduled journey start - Time the journey was scheduled to start.
-
Vehicle - Indicates the vehicle’s identifiers (ID, label, or both).
*If filters are applied for “Timing points only” then these fields will reflect the time from the previous timing point to current timing point. For example, “Dwell time from previous timing point” will consist of the total dwell time of all stops between the two timing points.