
The Stops layer is your essential tool for quickly identifying and exploring all stop locations within the network. This layer ensures you always have this critical information at your fingertips.
How Stops are visualised
-
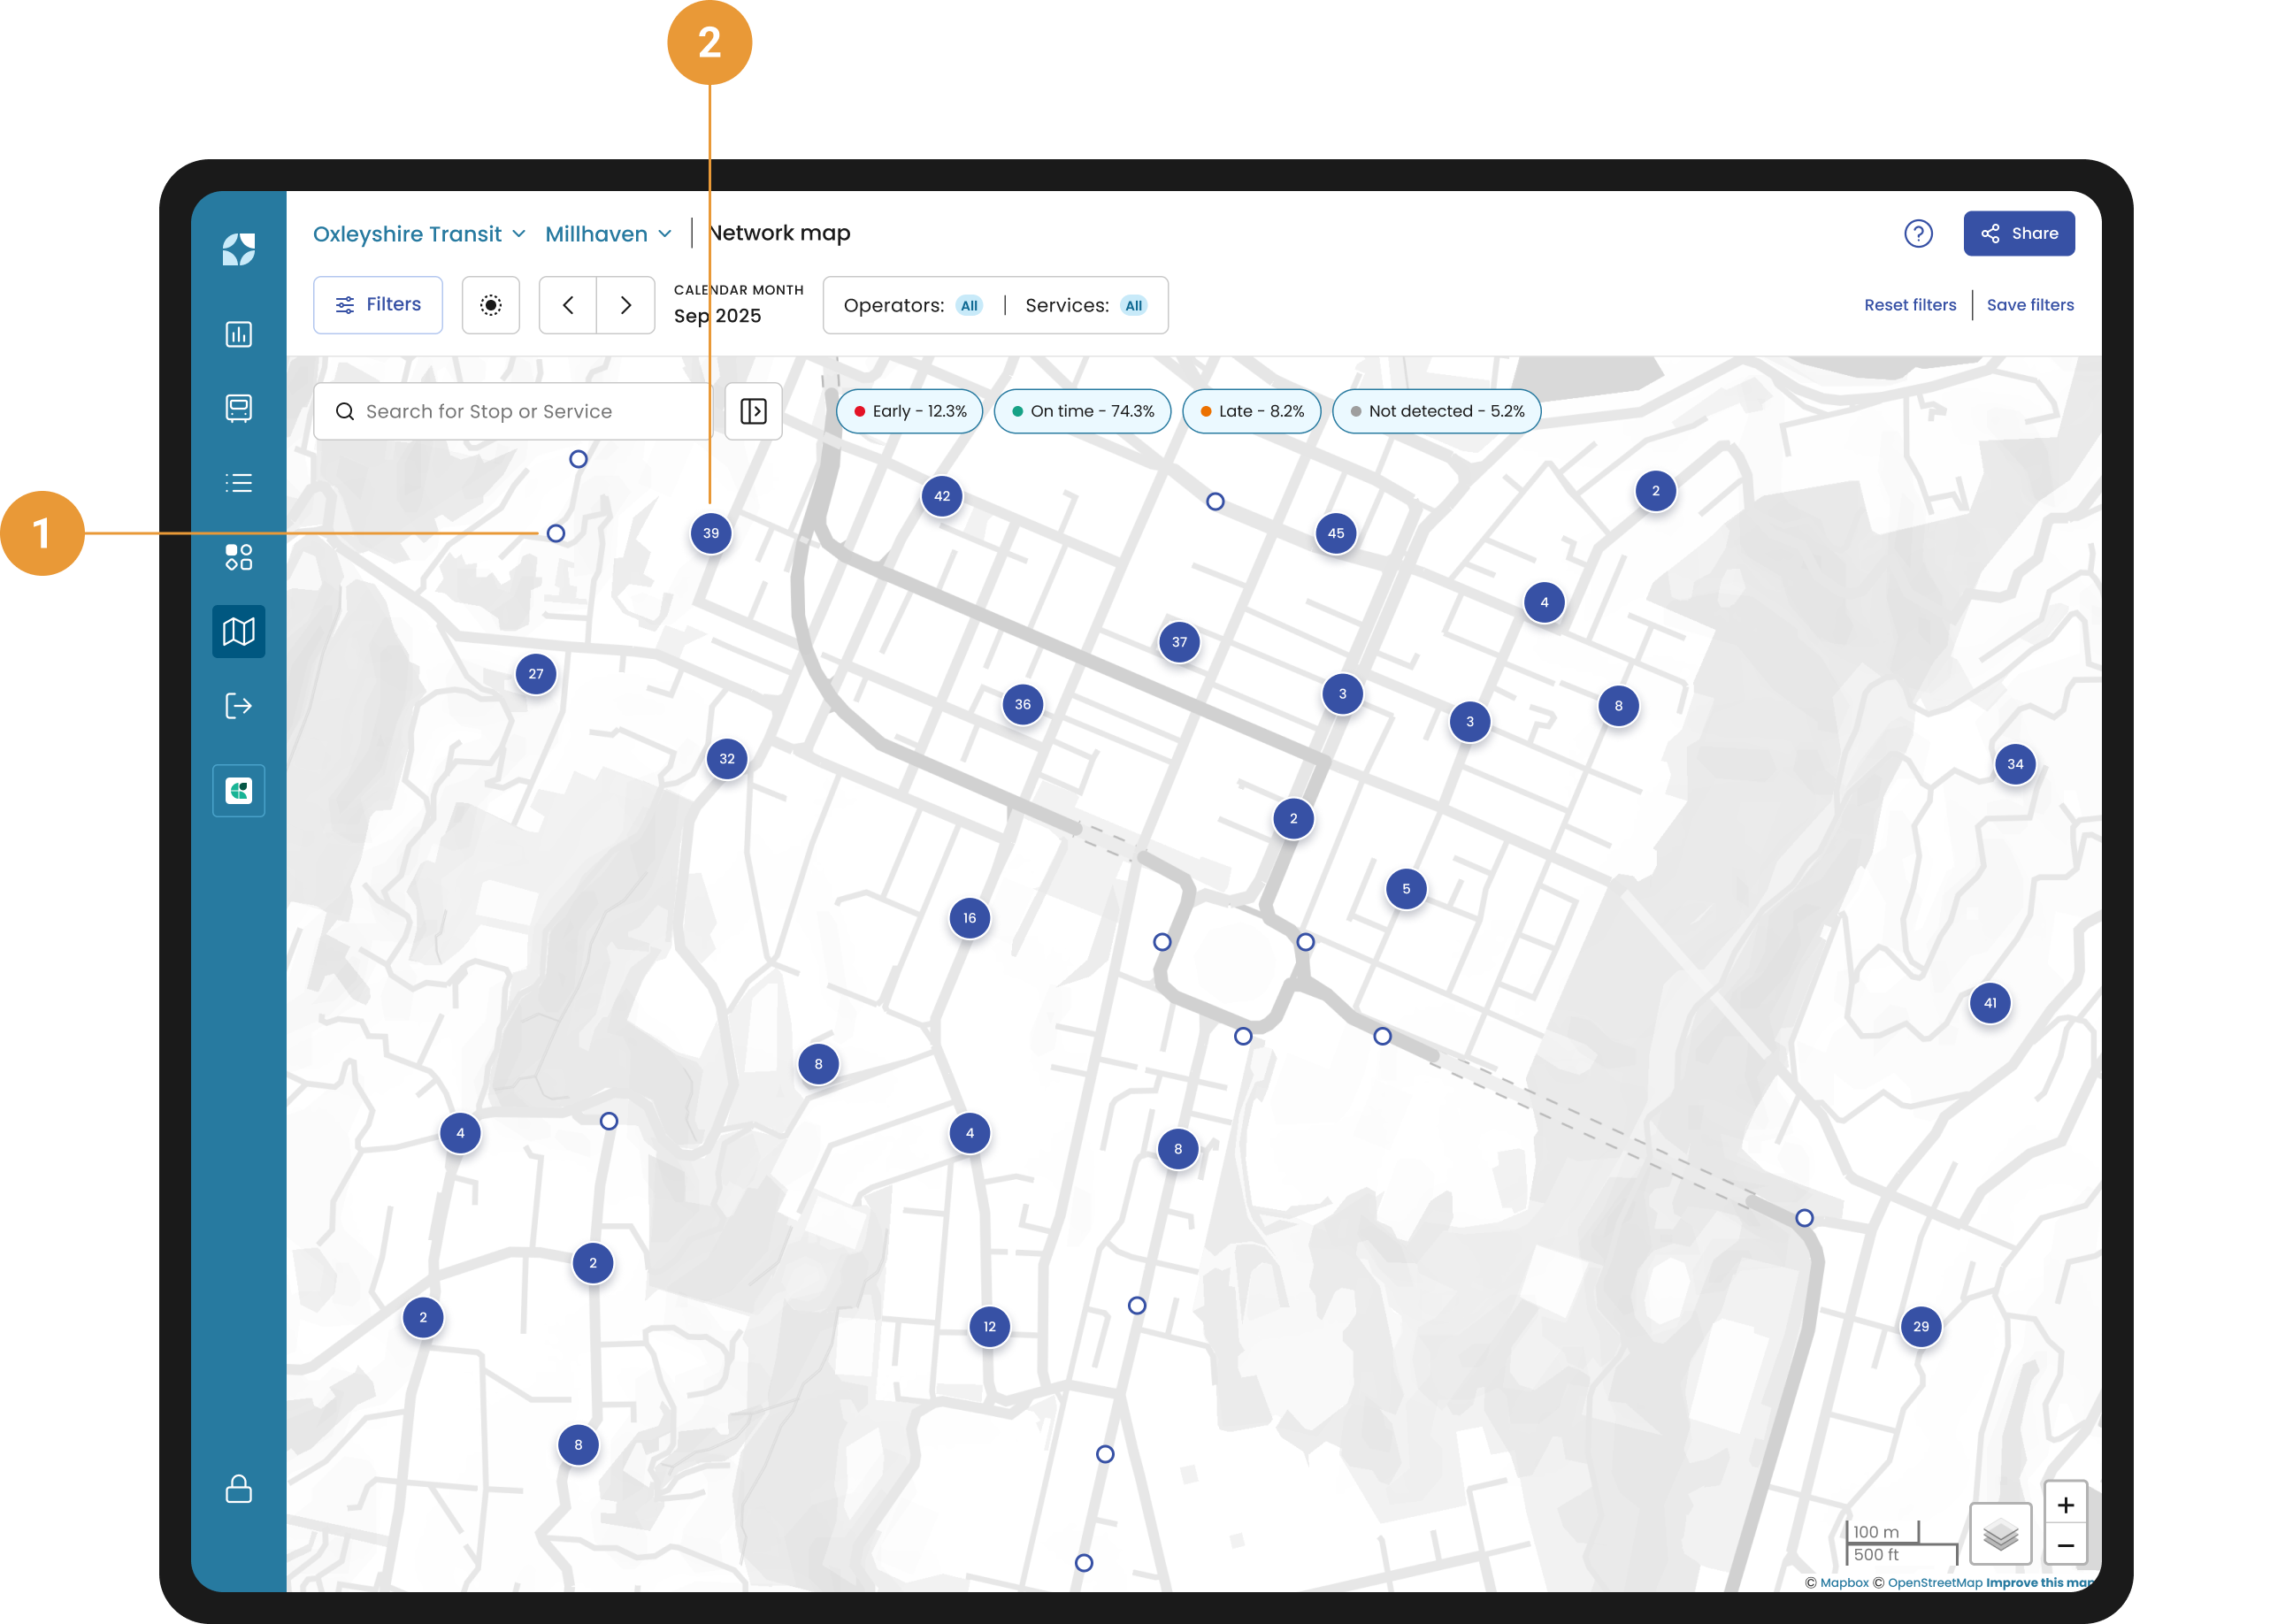
Stops appear as blue circles on the map (1), making them easy to identify.
-
When zoomed out, stops are grouped into clusters (2), with the number of stops displayed on each one.
-
As you zoom in, clusters break apart, and individual stop locations become visible with precise details.
Interactive Features
-
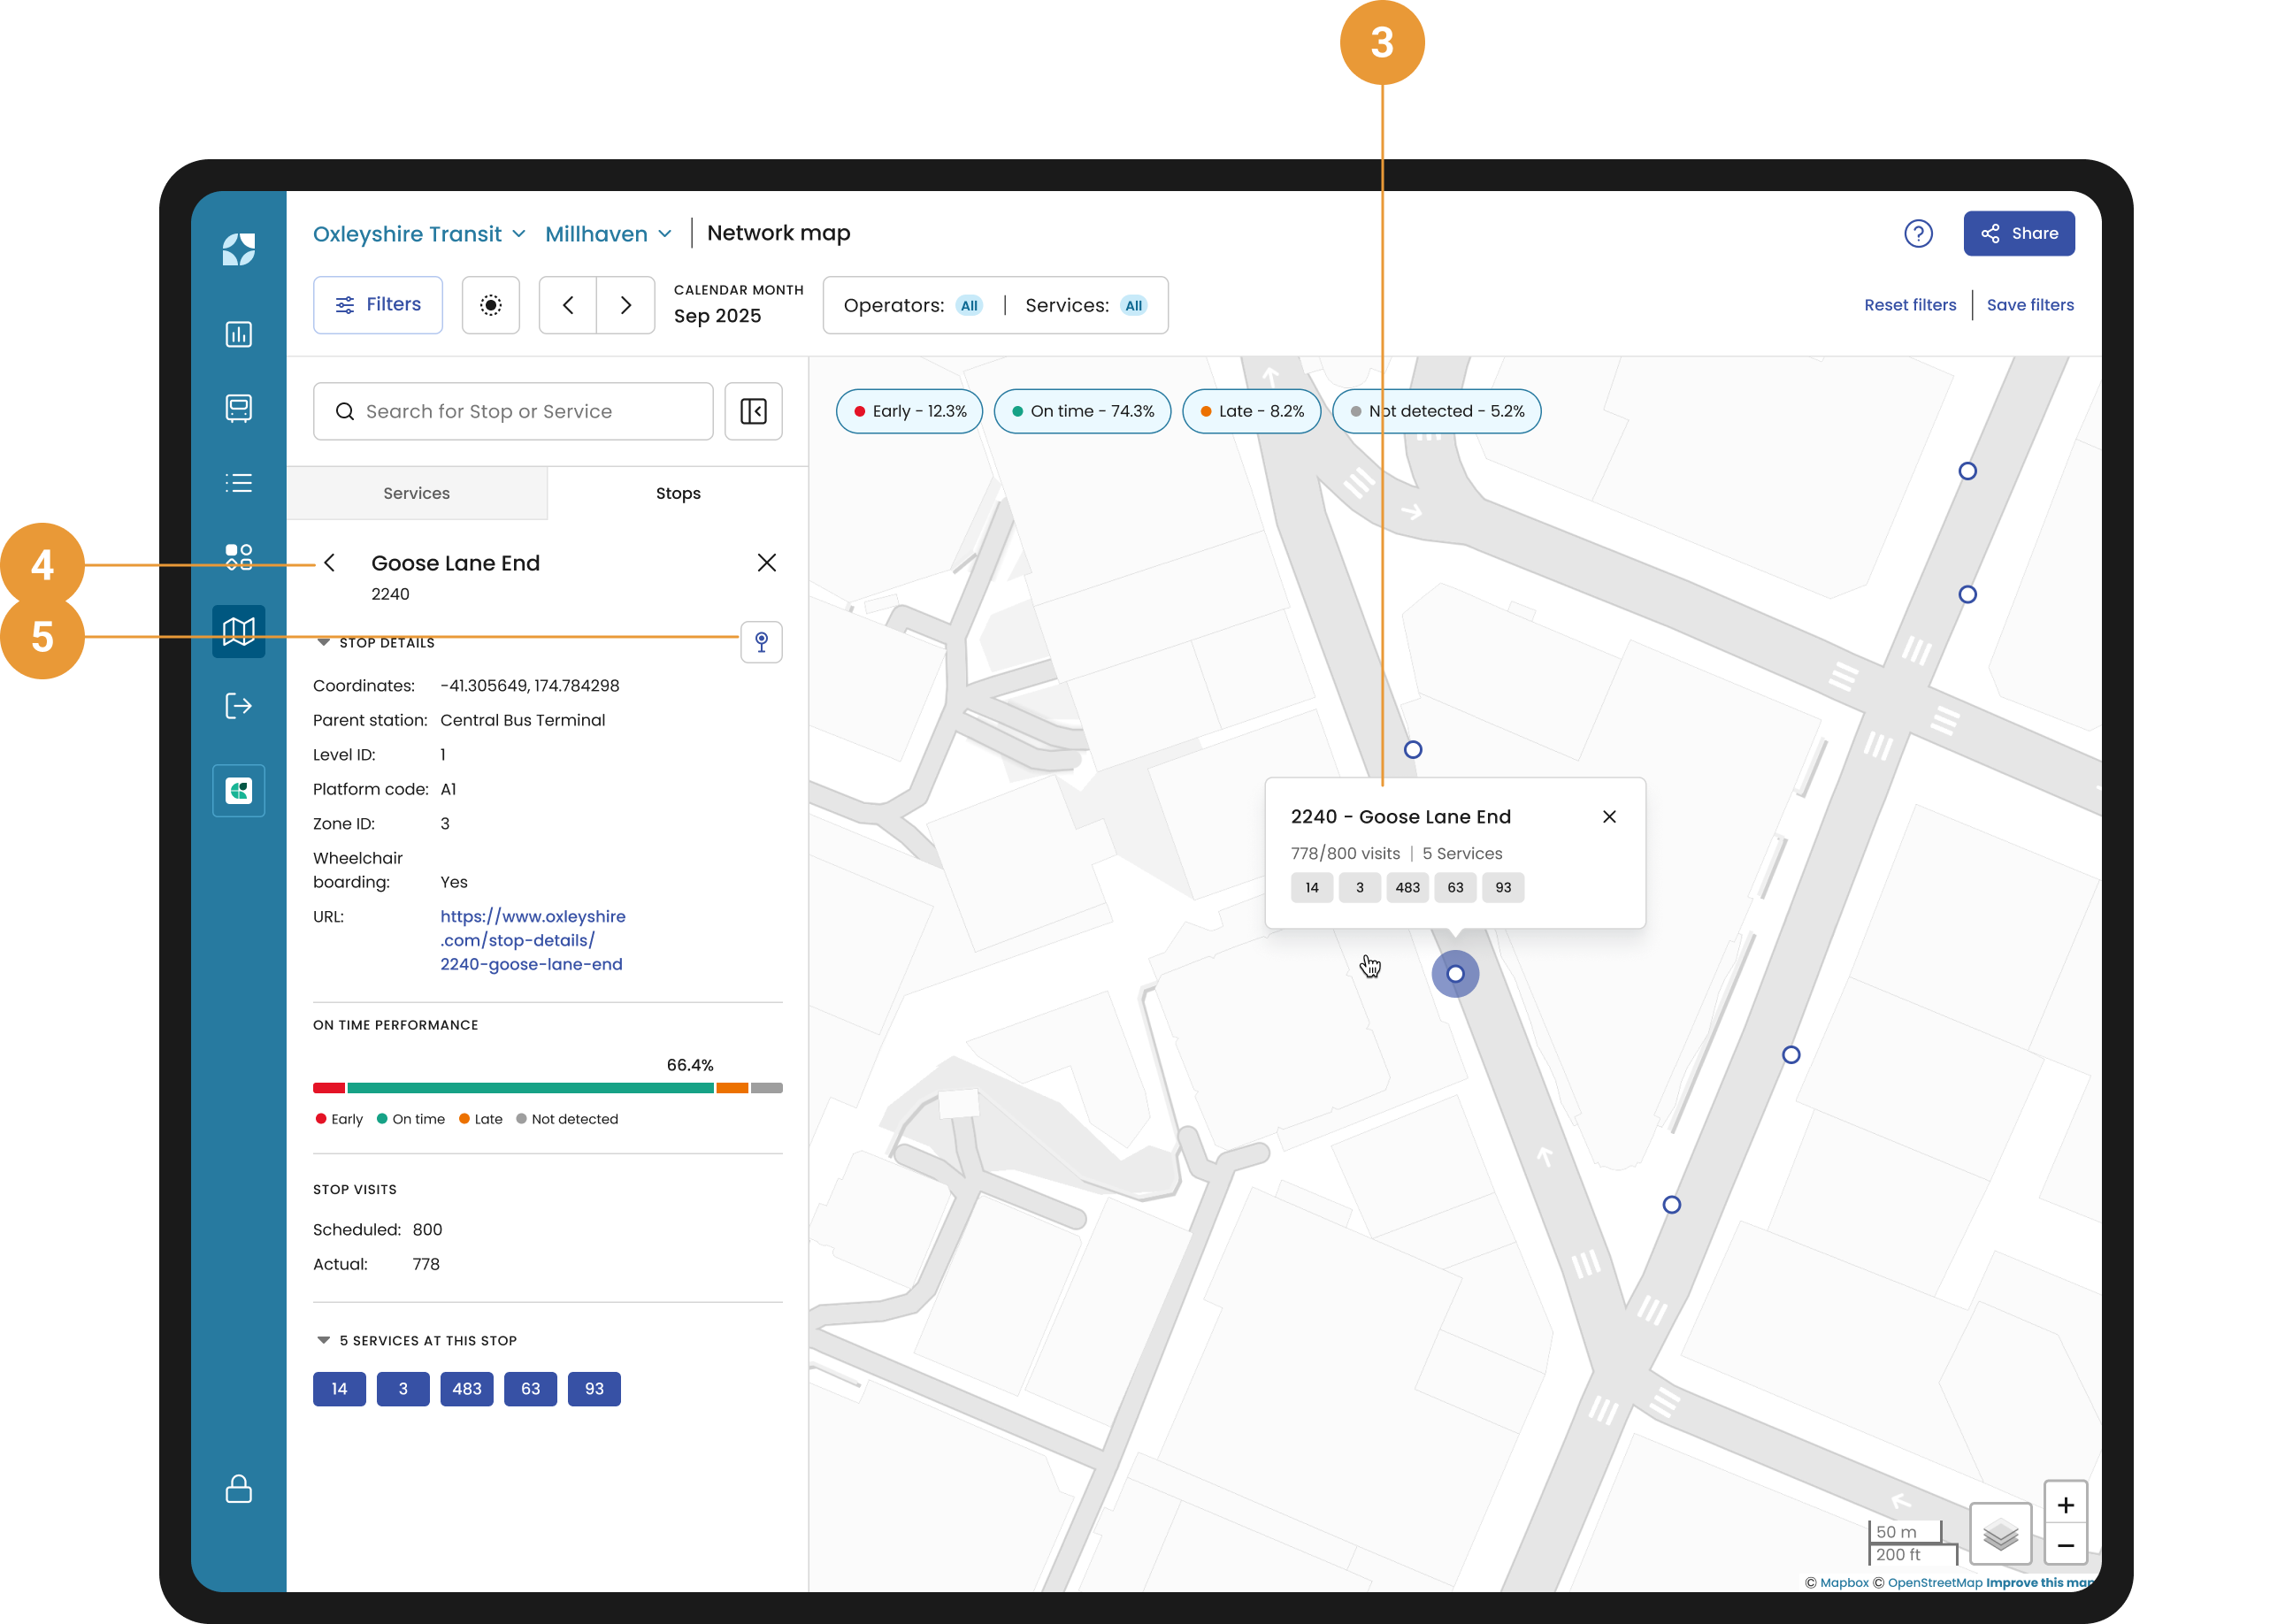
Hover over stops (3): Get an instant pop-up showing key information, including:
-
Stop ID and name.
-
The number of actual visits compared to the expected visits.
-
A list of services in your network that use this stop.
-
-
Click on a stop (4): Open a detailed left-side panel with more information, including:
-
The On-Time Performance of the stop.
-
Additional data to help you assess its performance.
-
To dive deeper into the stop’s details, click on the icon

-
-
Navigating Clusters:
-
When viewing clusters, the number of stops within each cluster is displayed.
-
Click on a cluster to zoom in and reveal smaller clusters or individual stops.
-
Continue clicking until individual stops are fully visible on the map.
-
Additional Tips
-
You can close the side panel at any time by clicking the

-
To view details for another stop, simply click on a different stop on the map. There’s no need to close the panel beforehand.