
The Services page allows you to review a service’s performance metrics as a summary of a period or in graphical form over time. It includes data quality, cancellations, distance data and on-time performance at key stops and timing points. Each service row in the list can be expanded to show its variants, so you can compare performance at a glance.
Users can view the on-time performance pattern across various stops, for different variants of a service operated by the same provider. This includes early and late averages for journeys that have visited those stops, making it simple to quickly identify areas where improvements are needed.
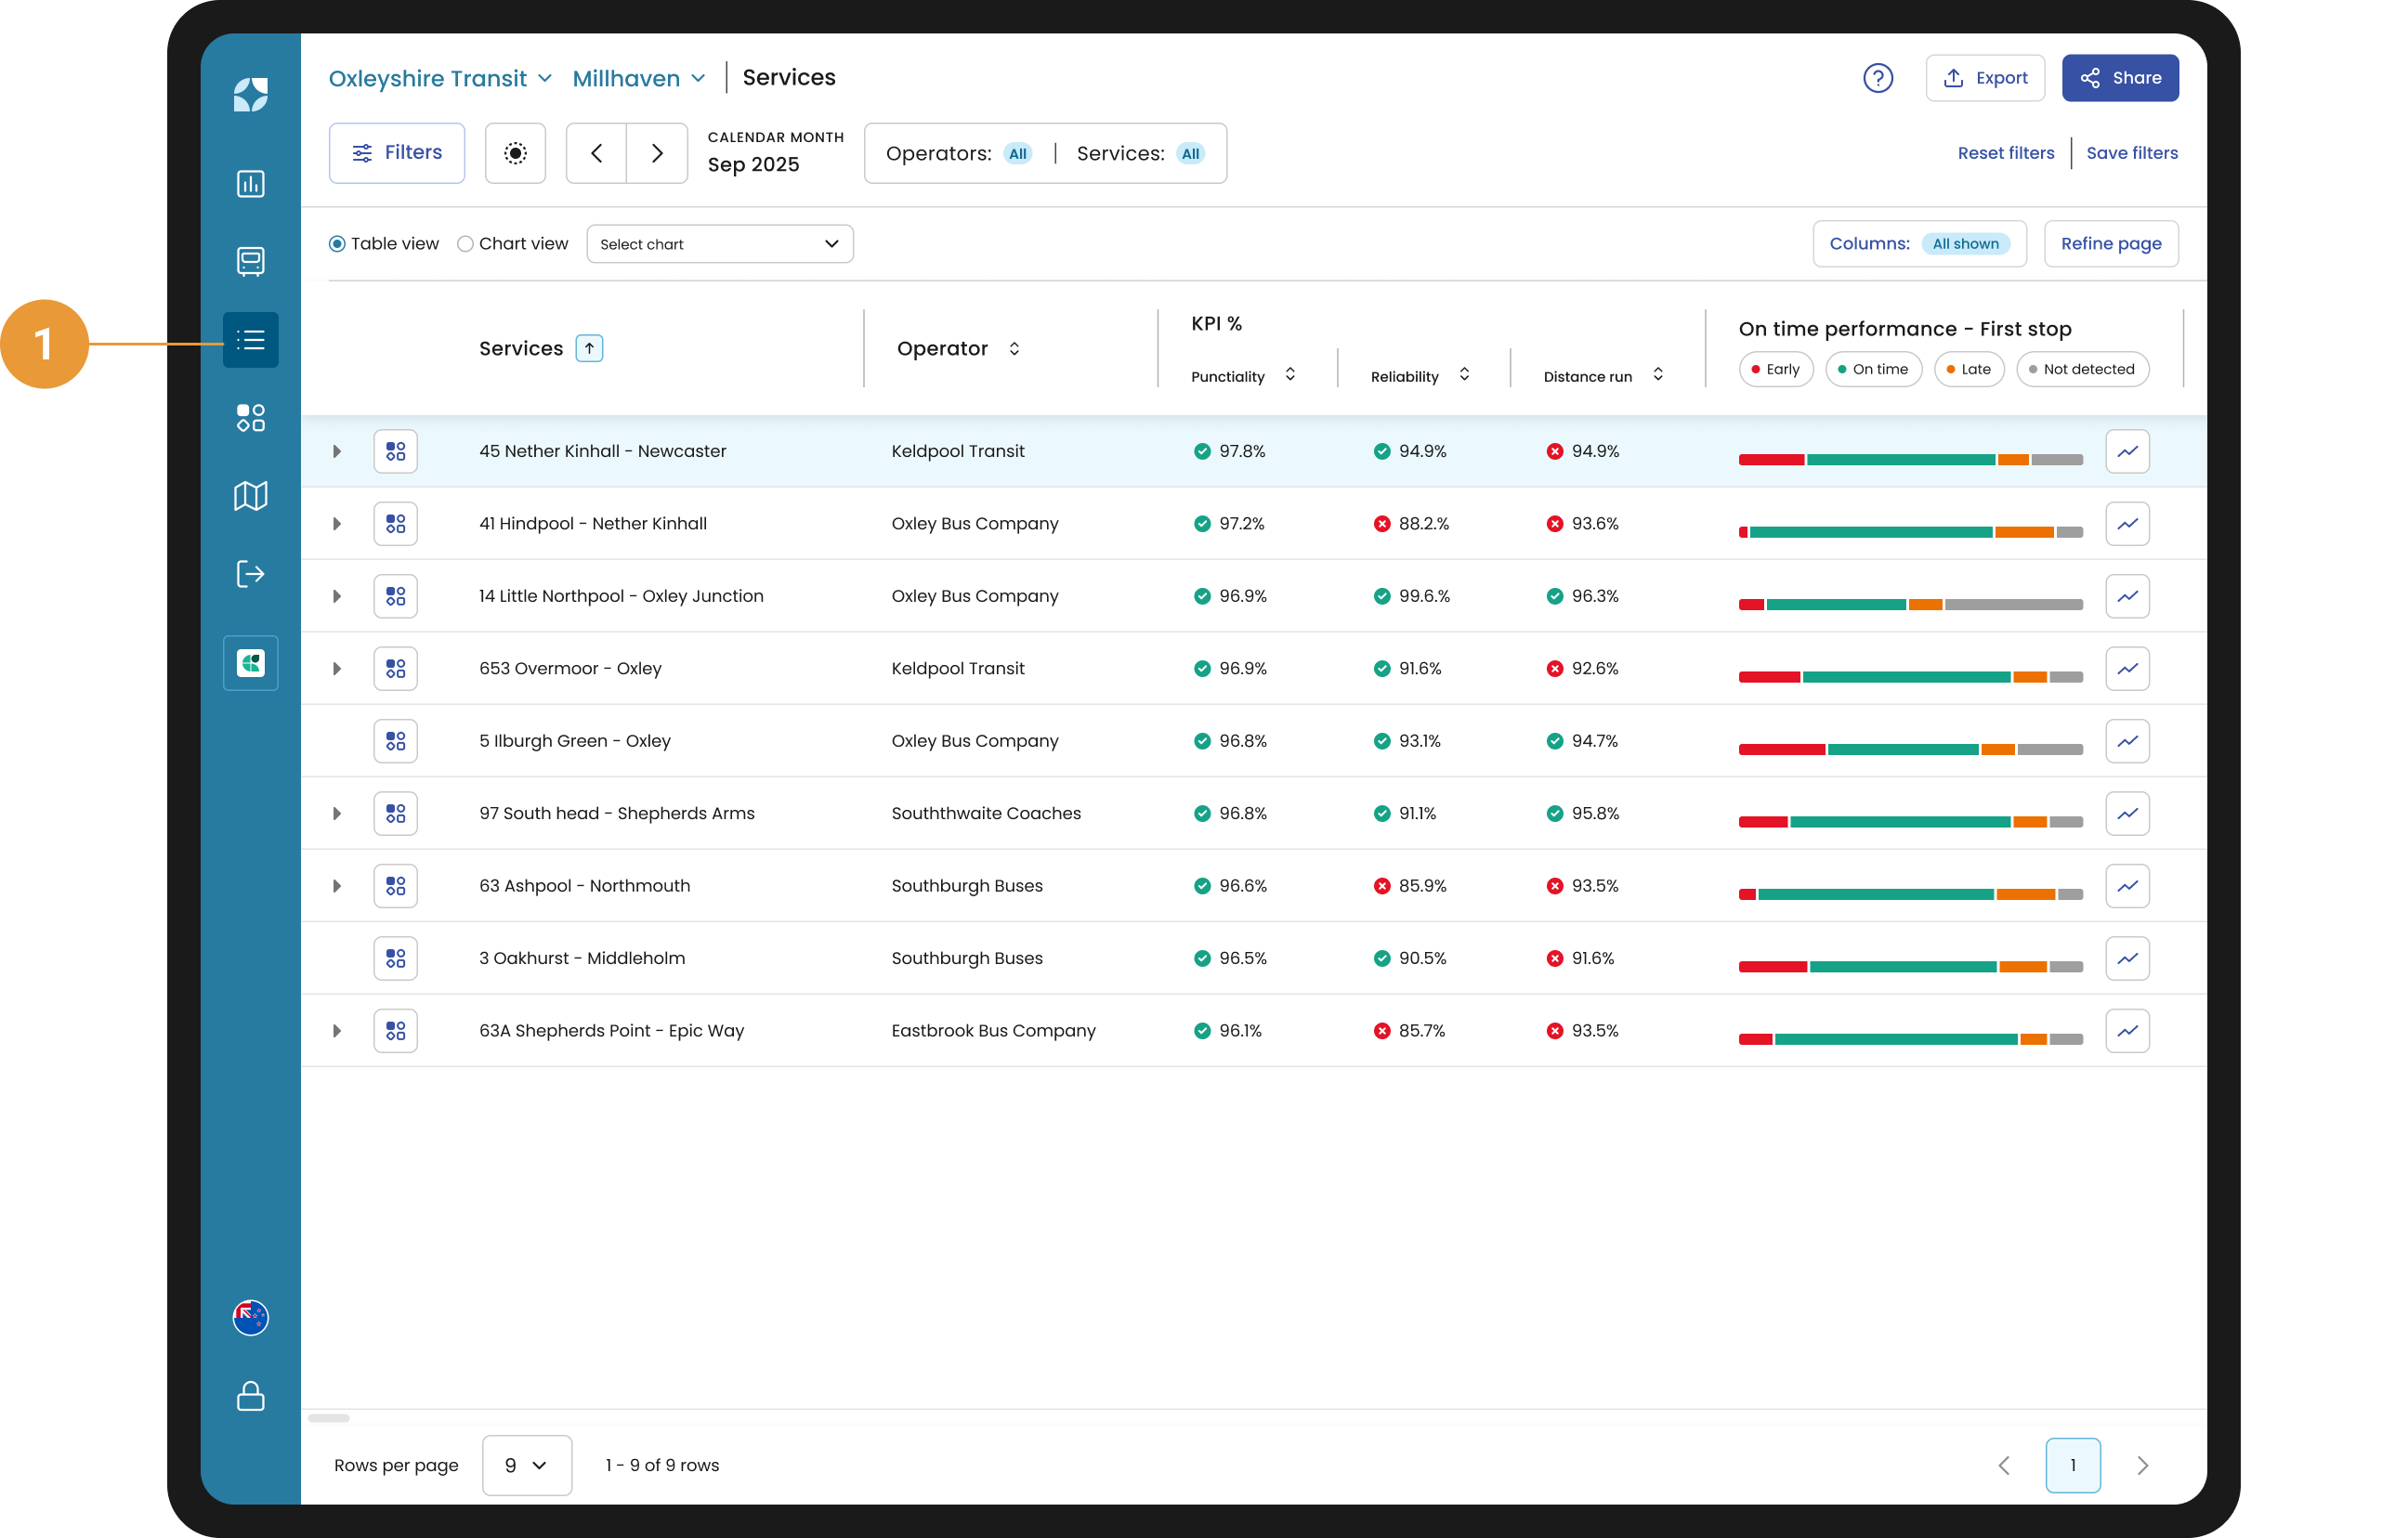
To see a list view of your Services, click Services in the left navigation (1).
Viewing and analysing service performance
-
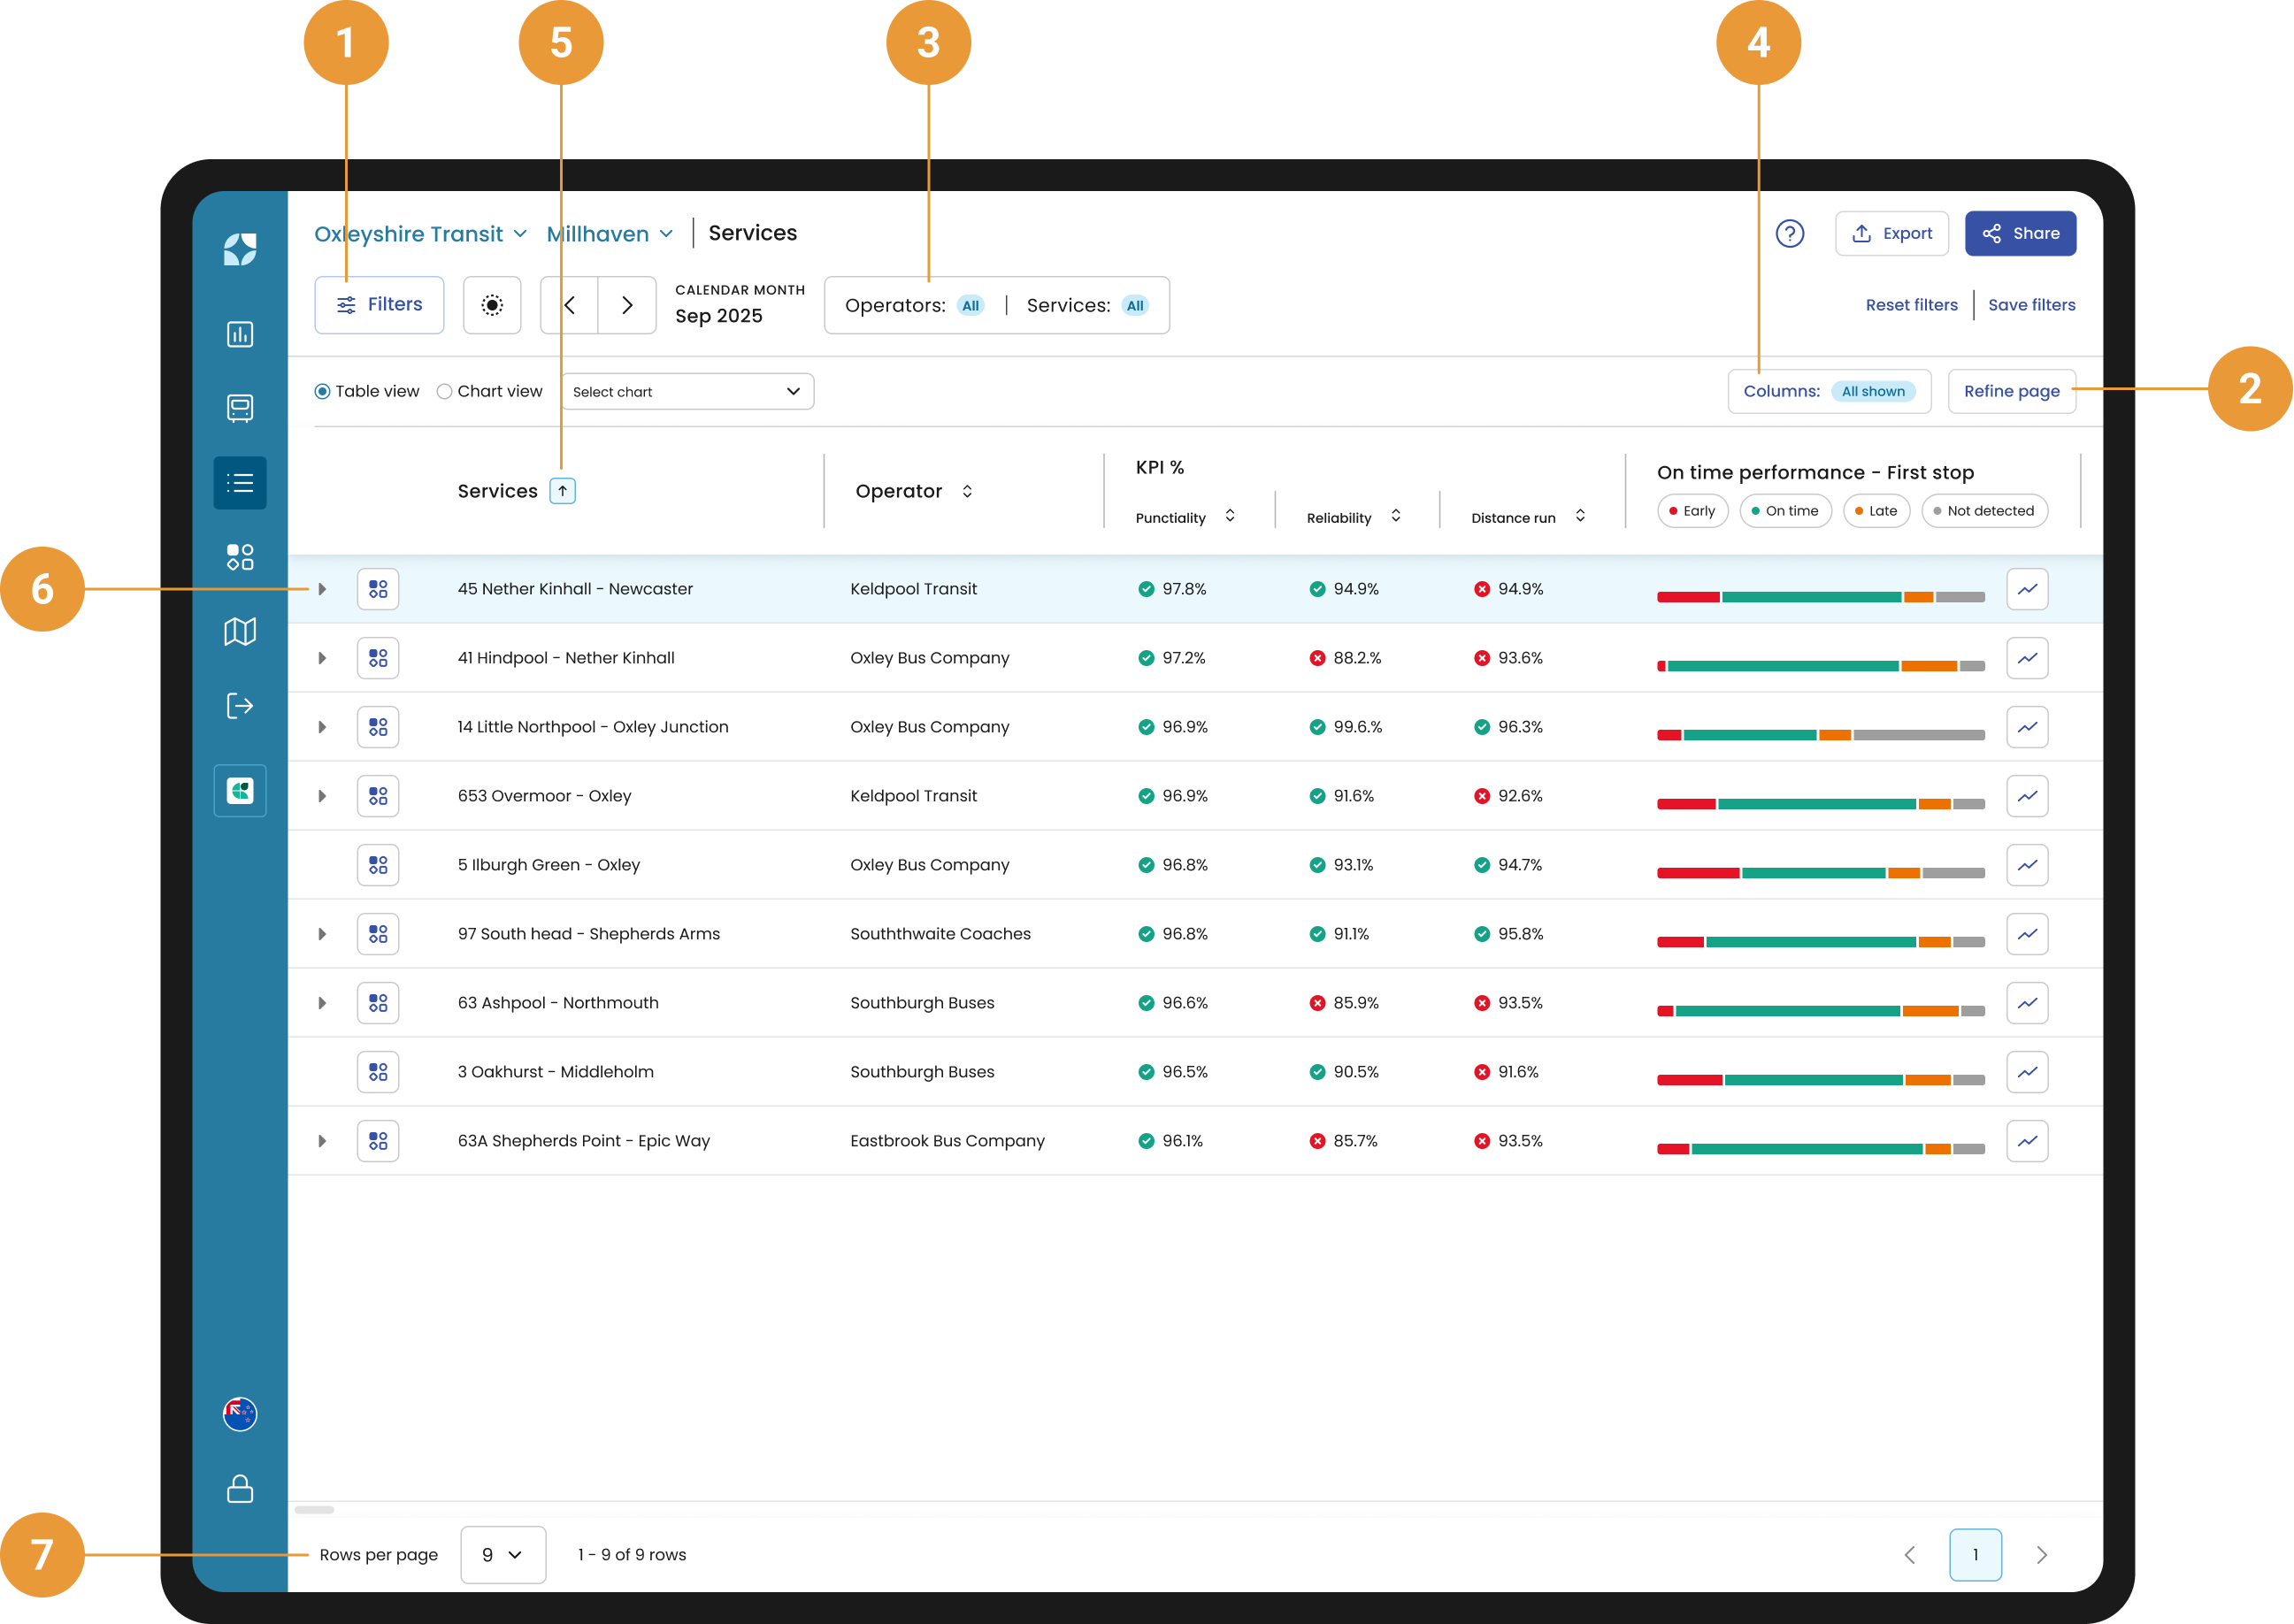
Use the filter hub (1) to select a specific date range to view.
-
Use the Refine page button (2) to select either an individual operator’s services or an individual service to view. The operators field will automatically be populated with the value from the page you have drilled down from. Any selection of operators or services from within the global operators/services filter (3) will influence what operators and services are available to be selected from within the refine page panel. Use the global operators/services filter if you want to compare multiple services for the selected date range. Each selected service is shown in alphabetical order by default.
-
Use the Columns button (4) to select which columns to display in the table.
-
Click on the column headers to sort the data as you wish – sorting arrows will appear to indicate which column the data is sorted by and in which direction (5). Sort data from descending to ascending or vice versa by service, operator, punctuality, reliability, distance or journeys matched metrics.
-
Click the chevron on a service row to expand and list that service’s variants. You can expand multiple services to compare variants side by side. Clicking again on the chevron at the left of the row collapses the variants back into the service row (6).
-
Your results will be shown in the table – you can specify how many rows you want to view per page, or you can use the tabs to the right to skip through the data page by page (7).
Viewing service variants performance
Variants are used to describe a specific version, or pattern, of a route, that is identified by a distinct sequence of stop visits.
In Mosaiq variants are named using <first stop name> - <last stop name> (<the total number of stops>). Please refer to FAQs for more information.
-
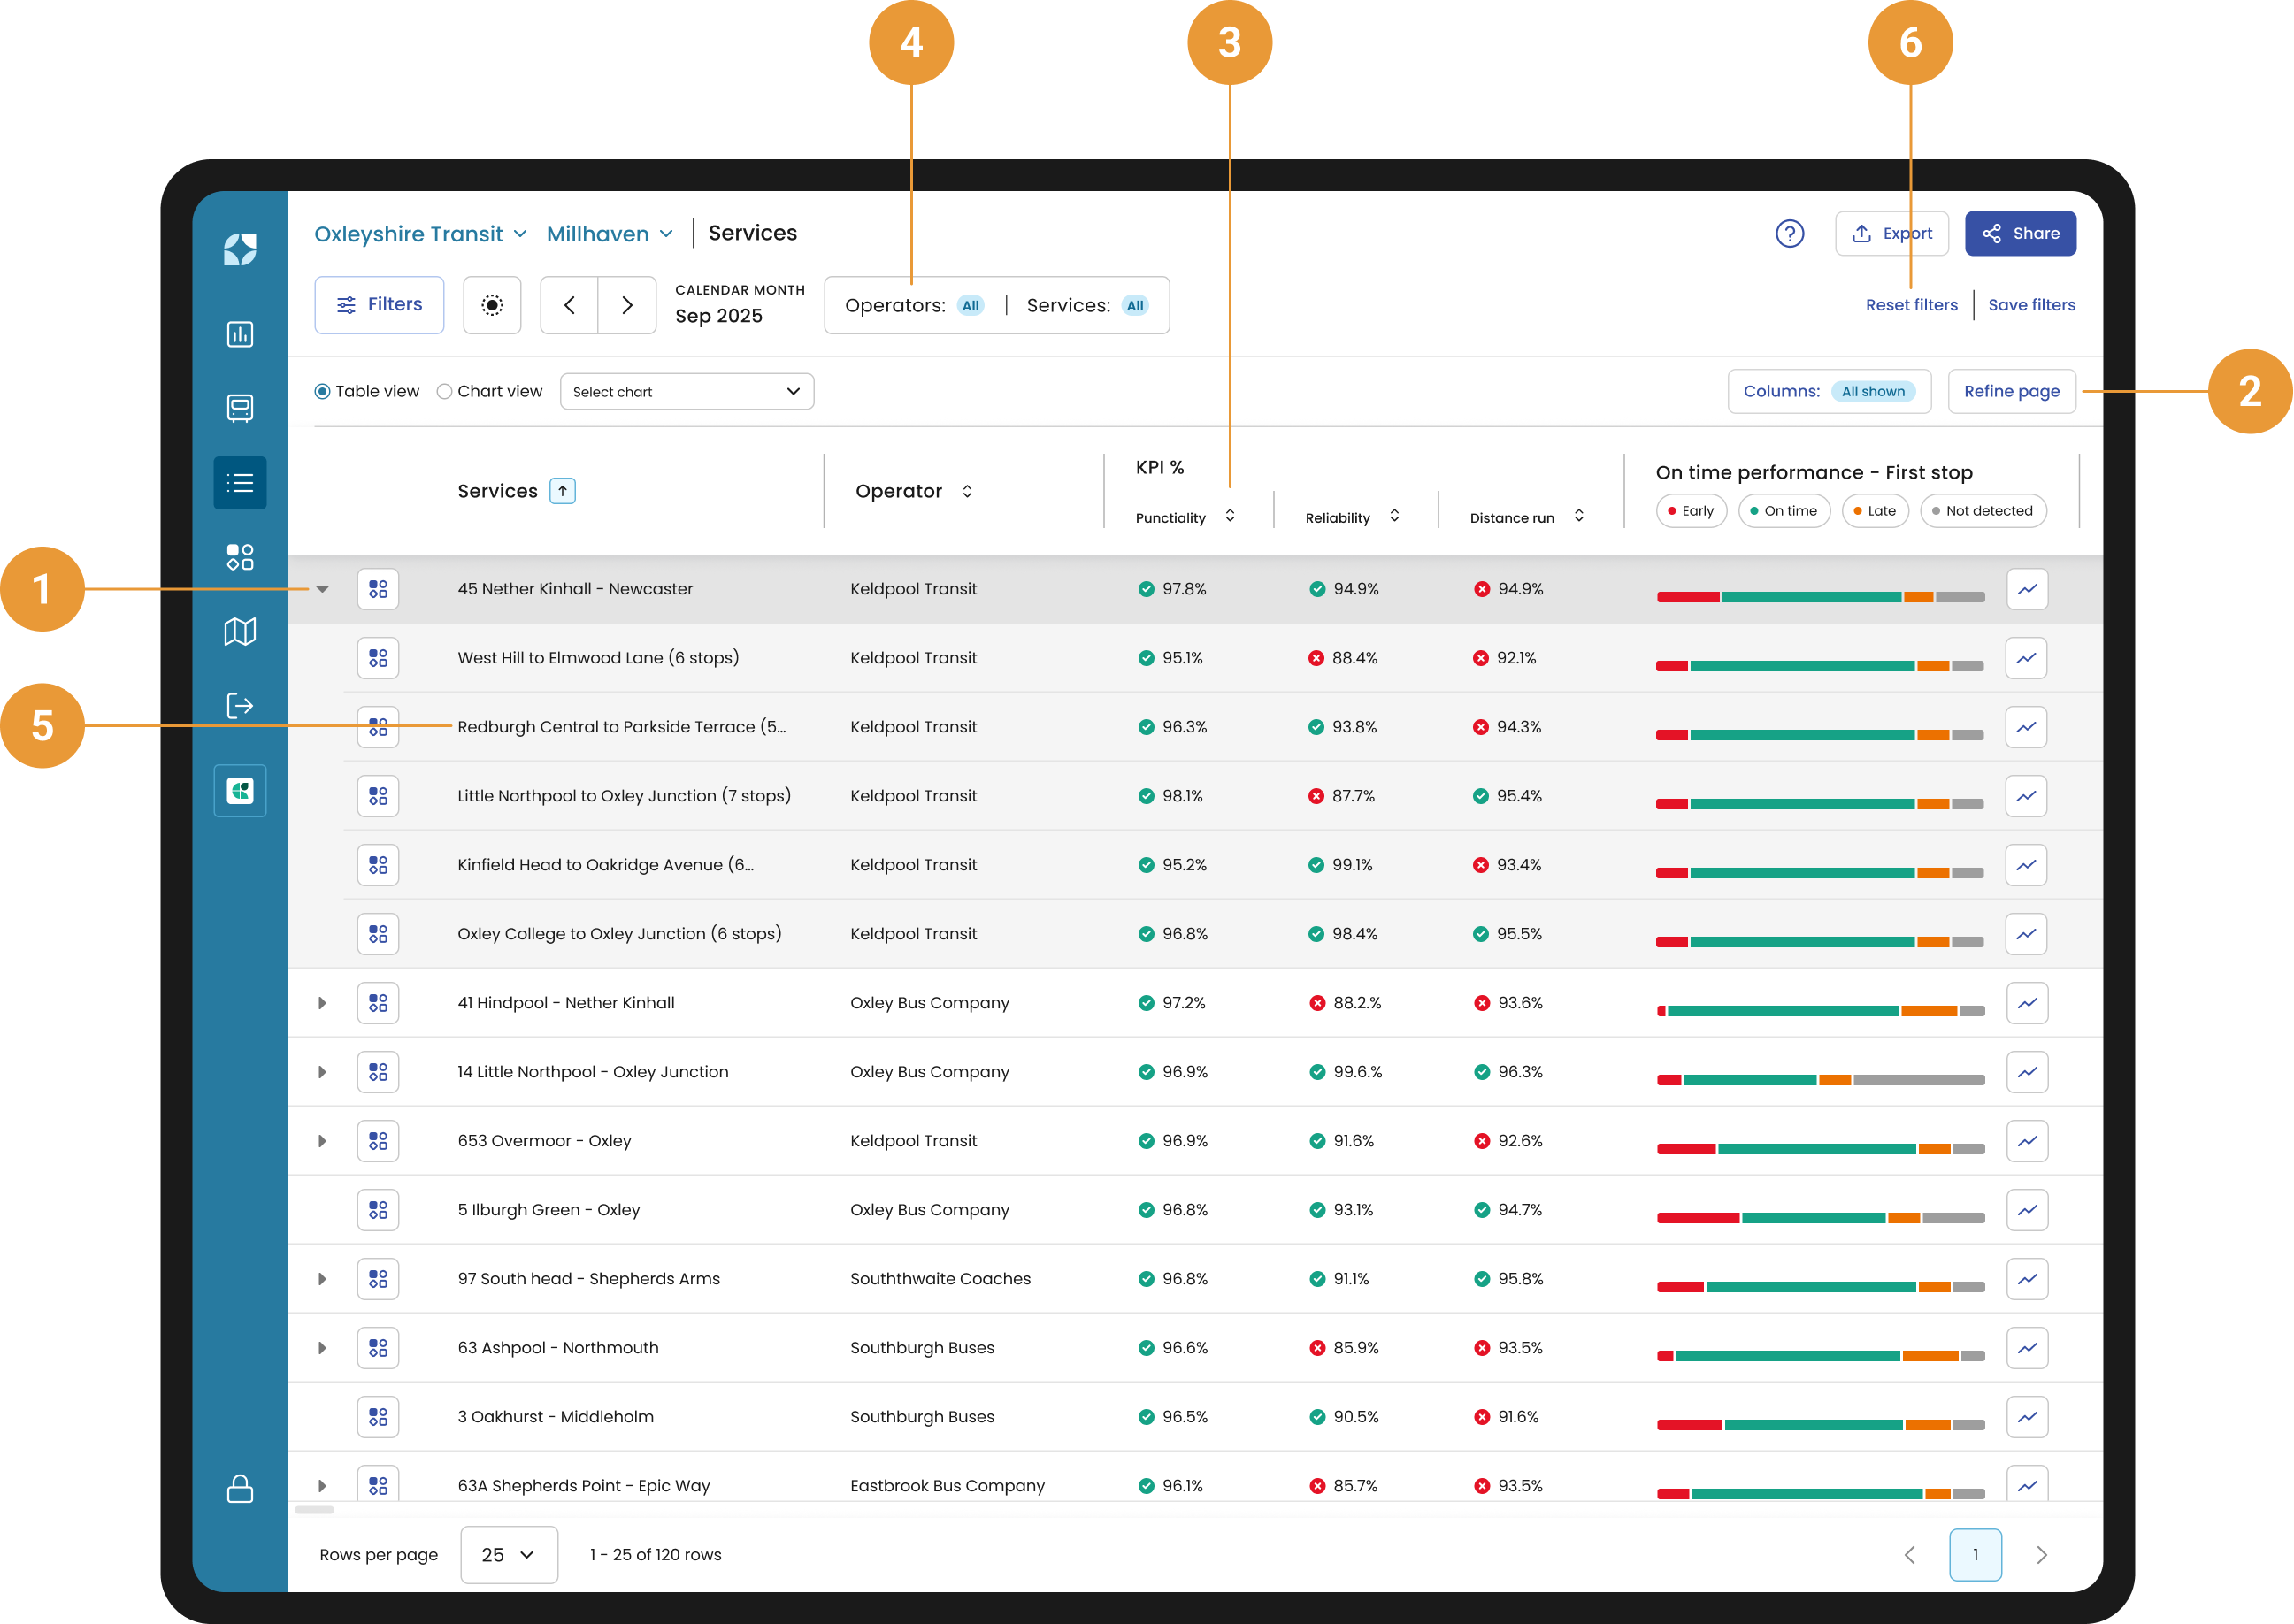
Open the variants list for a service by clicking the chevron at the start of the row (1).
-
Each variant is listed beneath its parent service, with the same columns where applicable: Punctuality, Reliability, On-time performance (Early/On time/Late/Not detected), Running times, and Journeys (2).
-
Sorting respects the active column within the expanded list. If you sort by Punctuality or Reliability, variants reorder within their service, and services reorder relative to each other (3).
-
Filters (date range, operators, services) apply to the visible variants. Selecting operators or services narrows which services and their variants appear (4).
-
Click on a variant name to open Service details pre-filtered to that variant (5).
-
Use the reset filters button to reset the list (6).
On-time performance
-
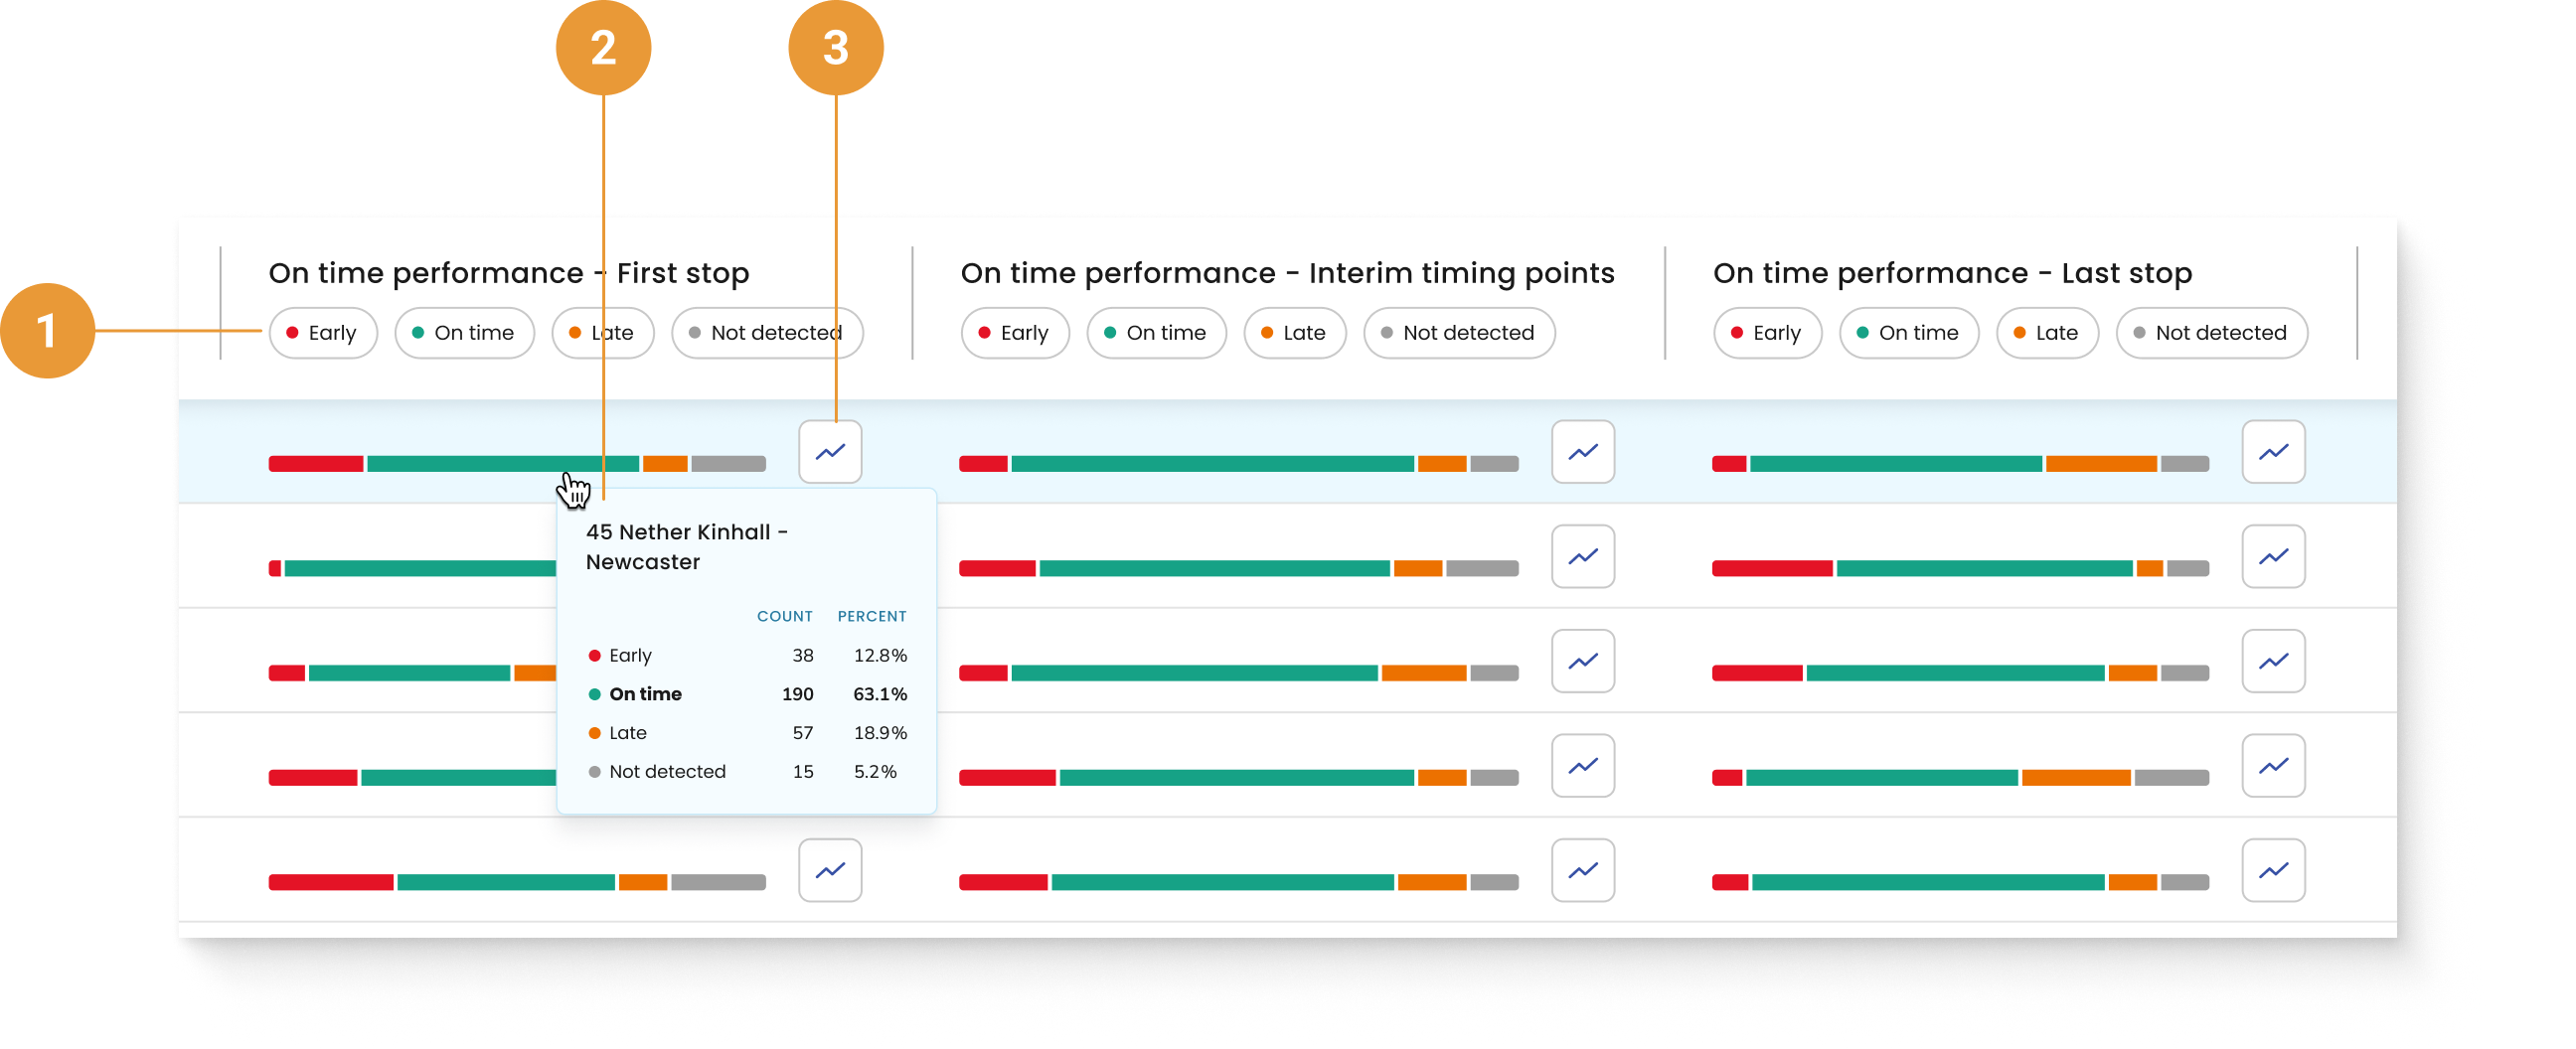
The early, on time, late and not detected buttons will order data accordingly and work in the same way as the On-time performance chart for the First stop, Timing point and Last stop (1).
-
A tooltip is available to view the on-time performance data in detail by hovering over the bar summary. (2)
-
You can navigate to the on-time performance chart for a specific service or variant by clicking the graph icon. (3)
Running times
-
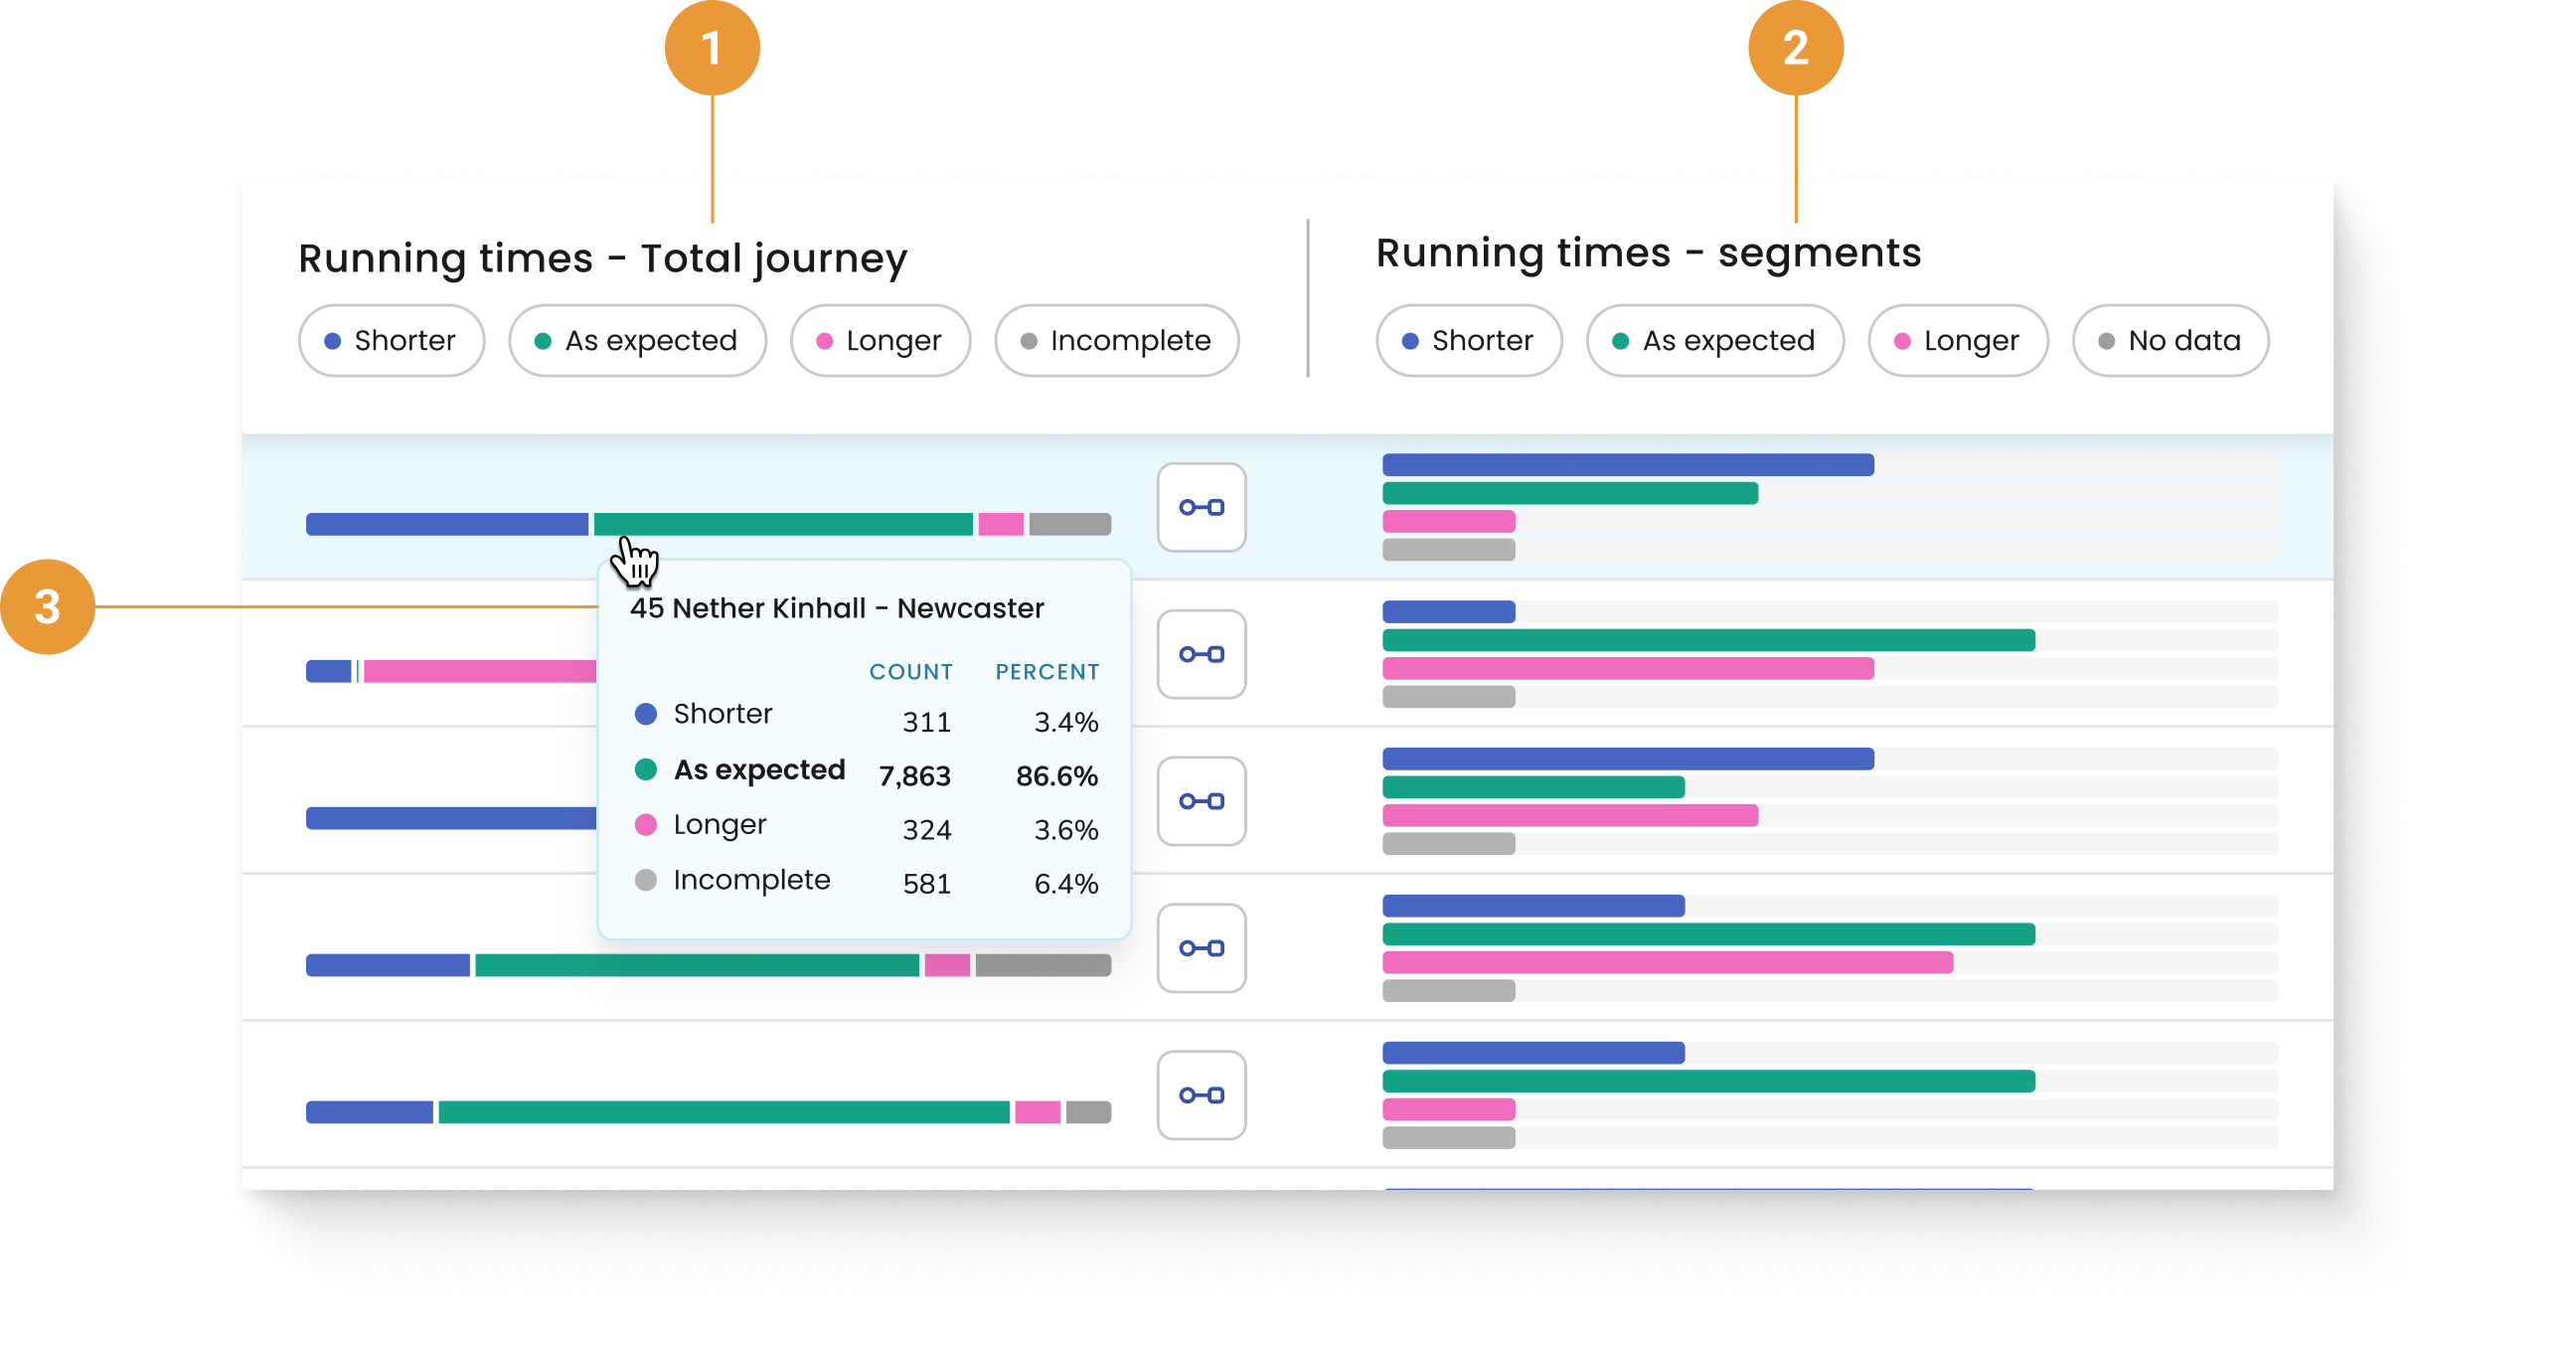
The Running times - Total journey chart provides a summary of the performance of the total journey duration for completed journeys of the selected Service (1).
-
The Running times - Segments chart provides a summary of the performance across all segments within the selected Service (2).
-
A tooltip is available to view detailed performance data by hovering over each of the bar summaries (3).
Distance
-
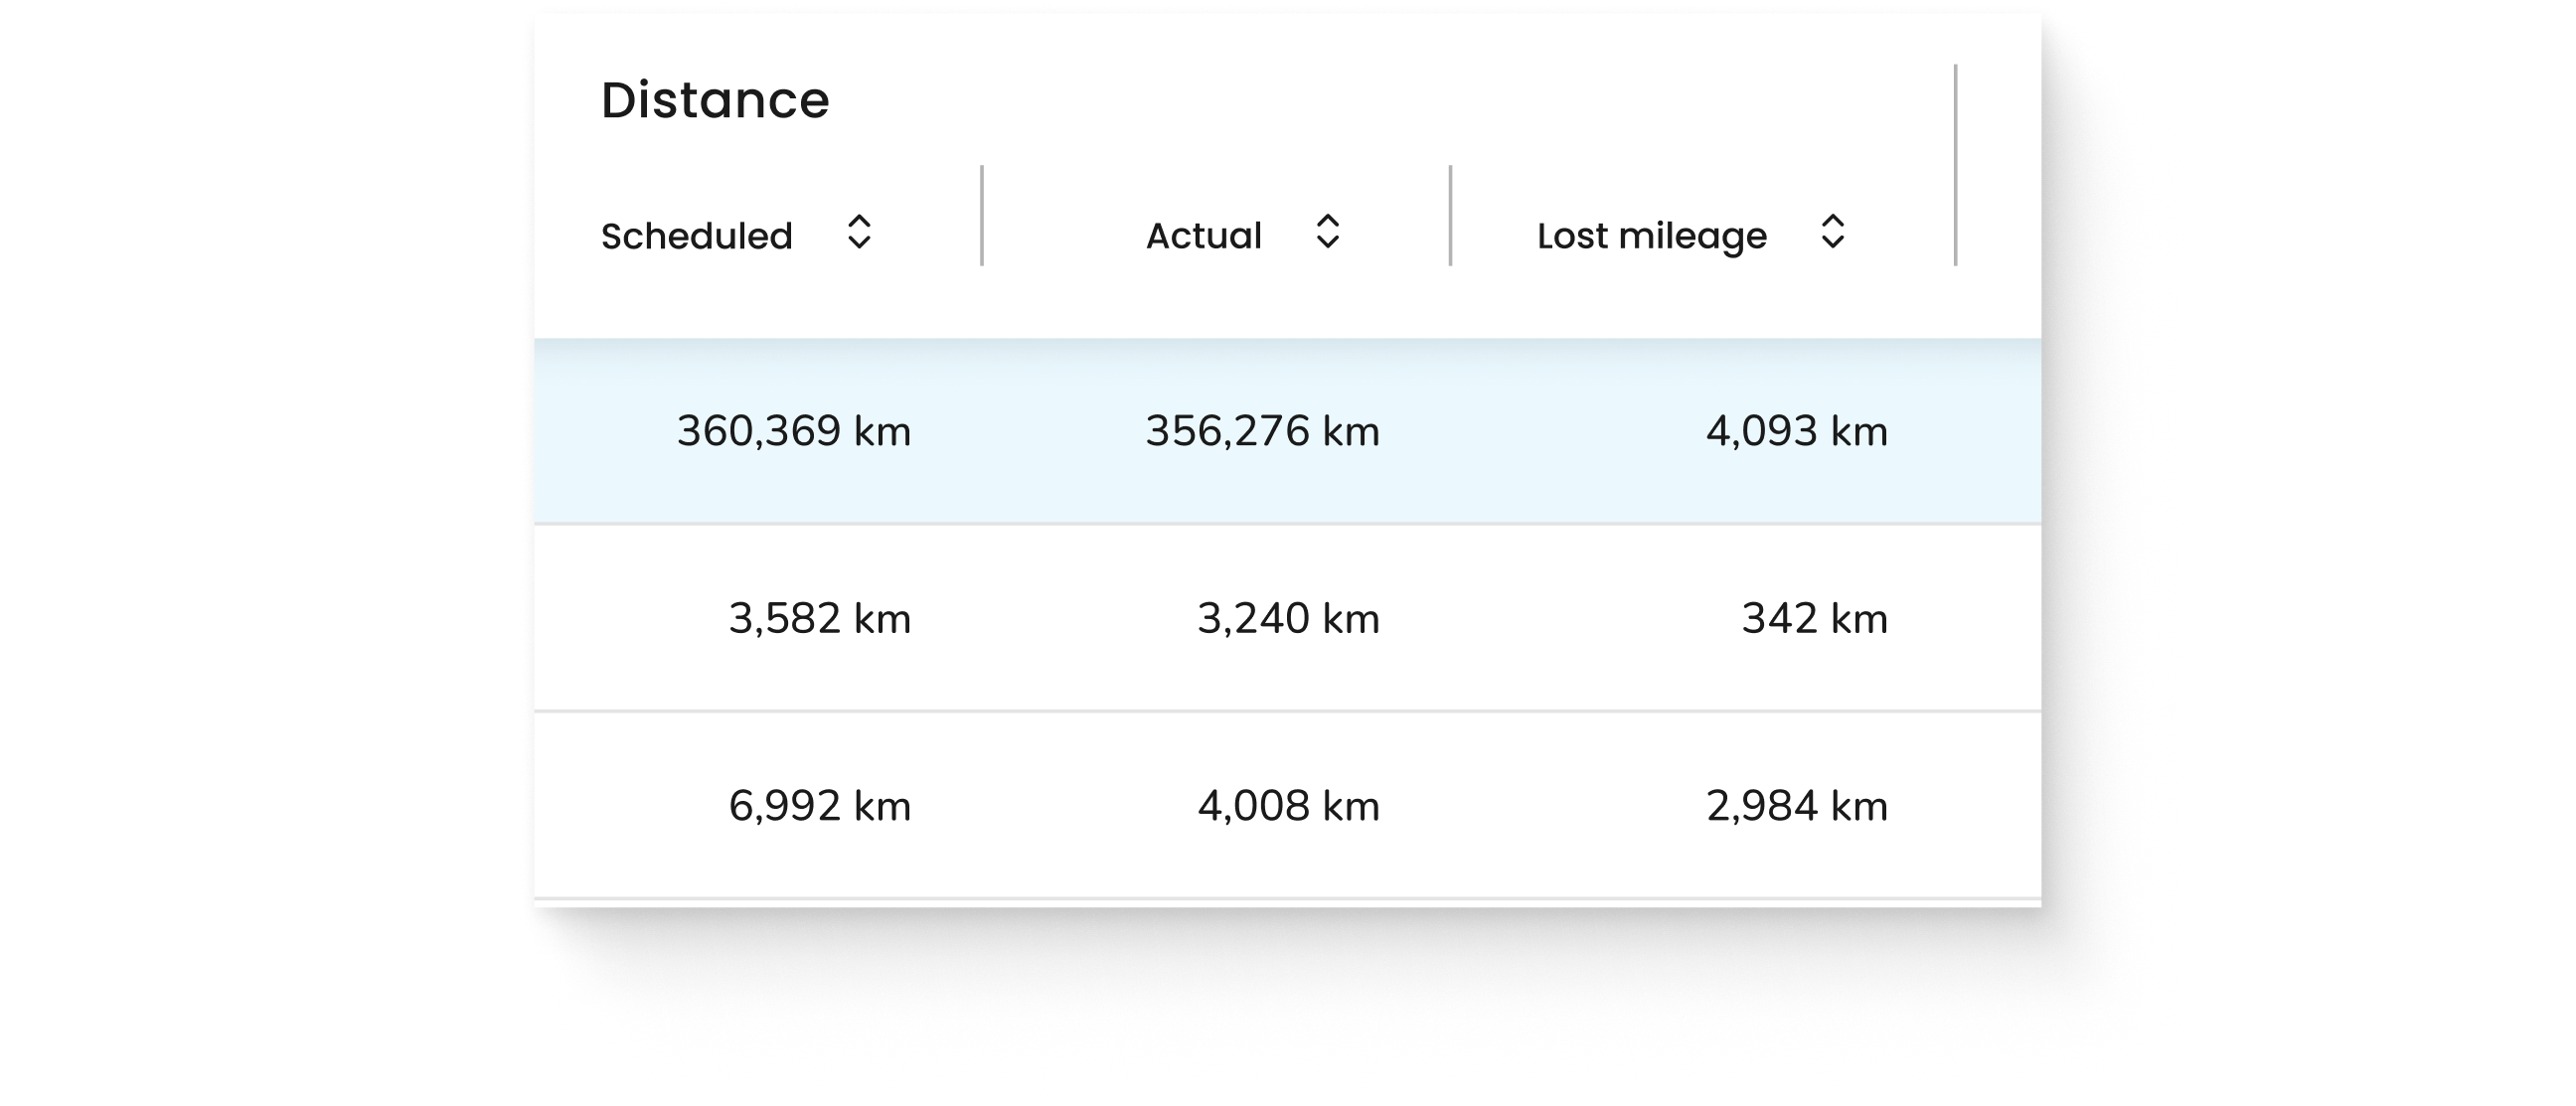
Distance metrics are available for all customers who provide
shape_dist_traveledin either theshapes.txtorstop_times.txtfiles with their GTFS upload. -
This dataset includes scheduled distance, actual distance run and the lost mileage for each service and variant for the selected period.
Journeys
-
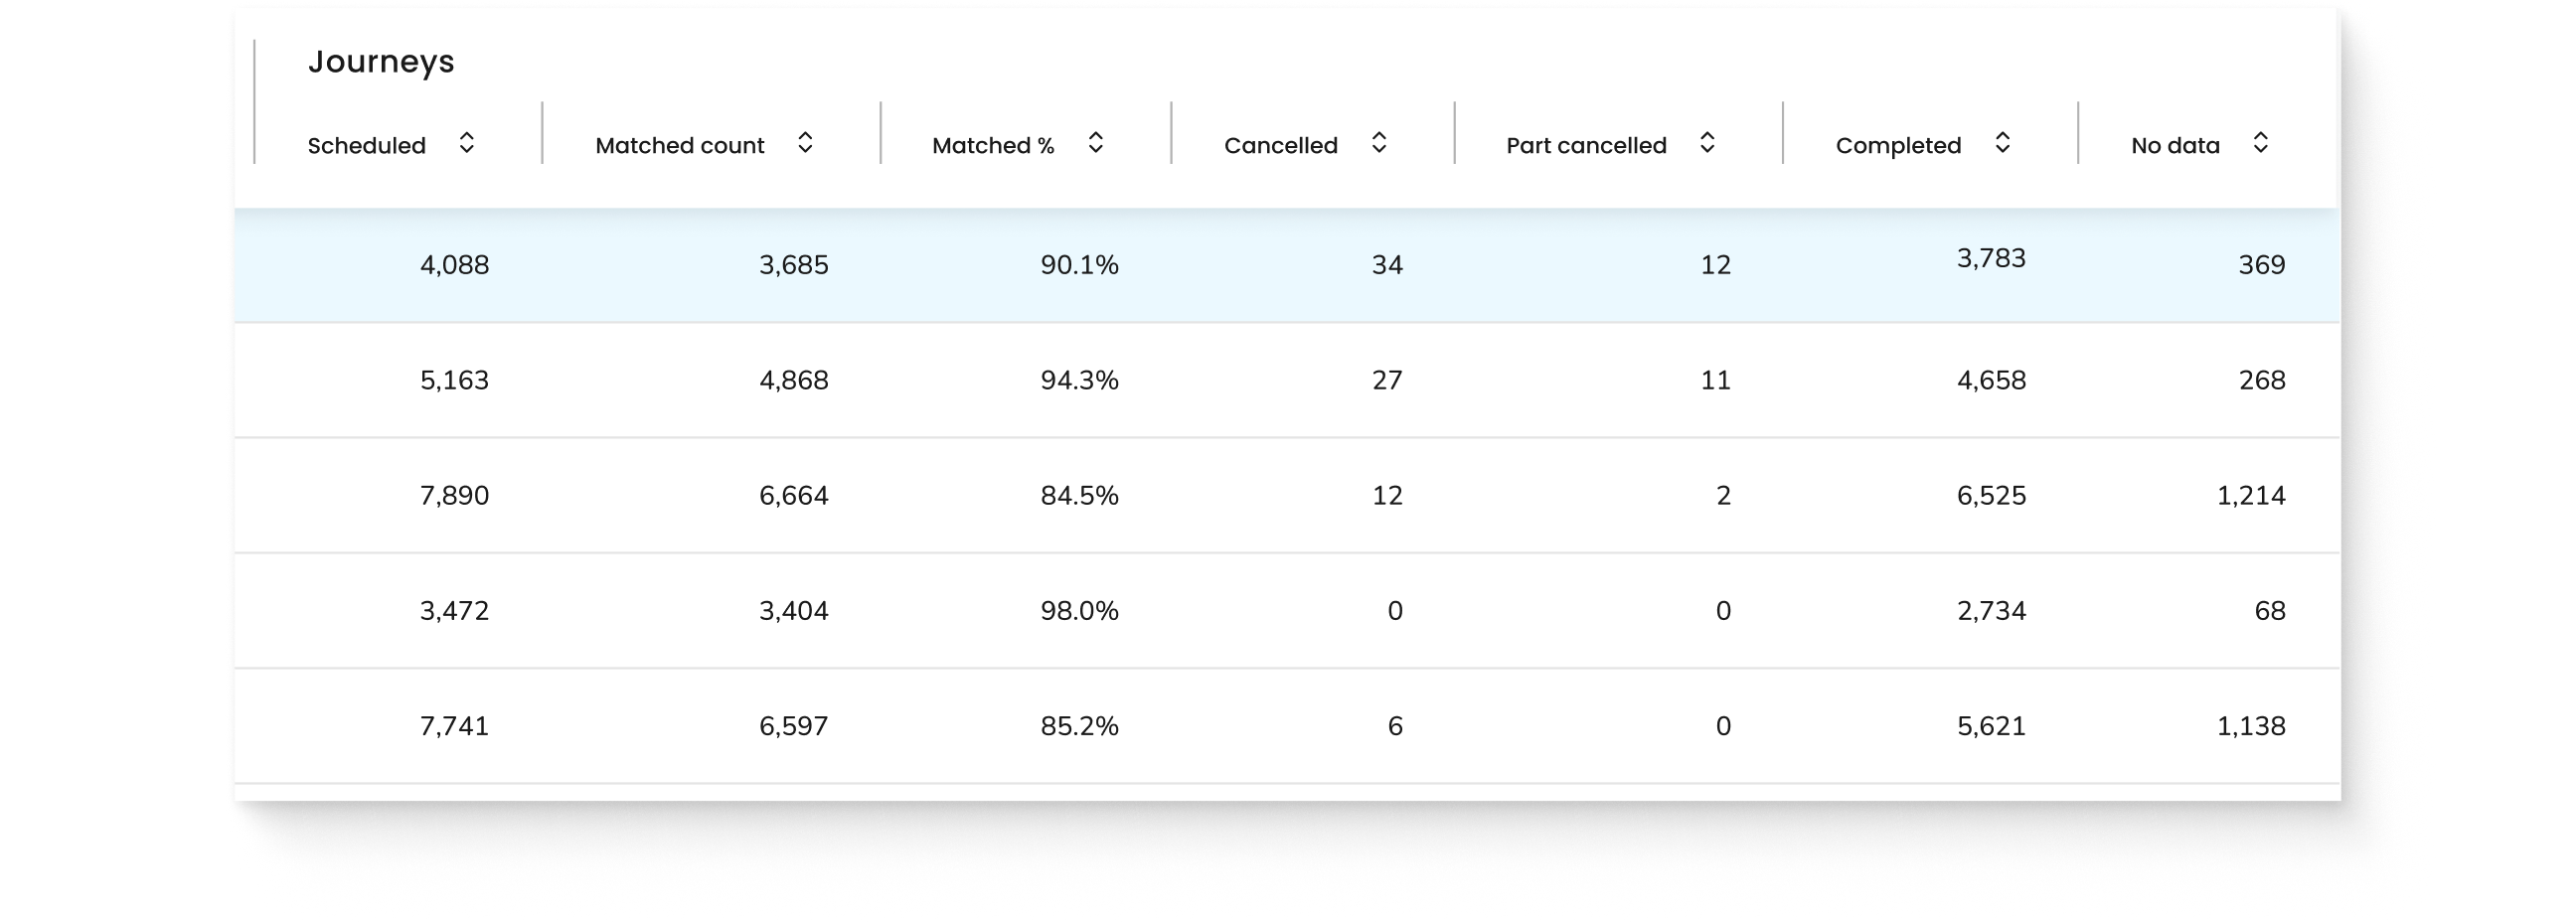
The Journeys category captures the number of completed journeys, journeys scheduled, the matched count, matched percentage, cancelled, part cancelled and no data columns.
The no data column is calculated as: (scheduled - matched count - cancelled = no data)