
The Default view of the Network map shows your network for a single period, with one map covering your selected date range, so you can spot problem areas at a glance rather than checking one stop or route at a time. Select a hexbin, stop, or route to open the side panel for more detail, including individual stop performance and route information. For trends over time, or to compare two periods side by side, use the Performance over time view instead.
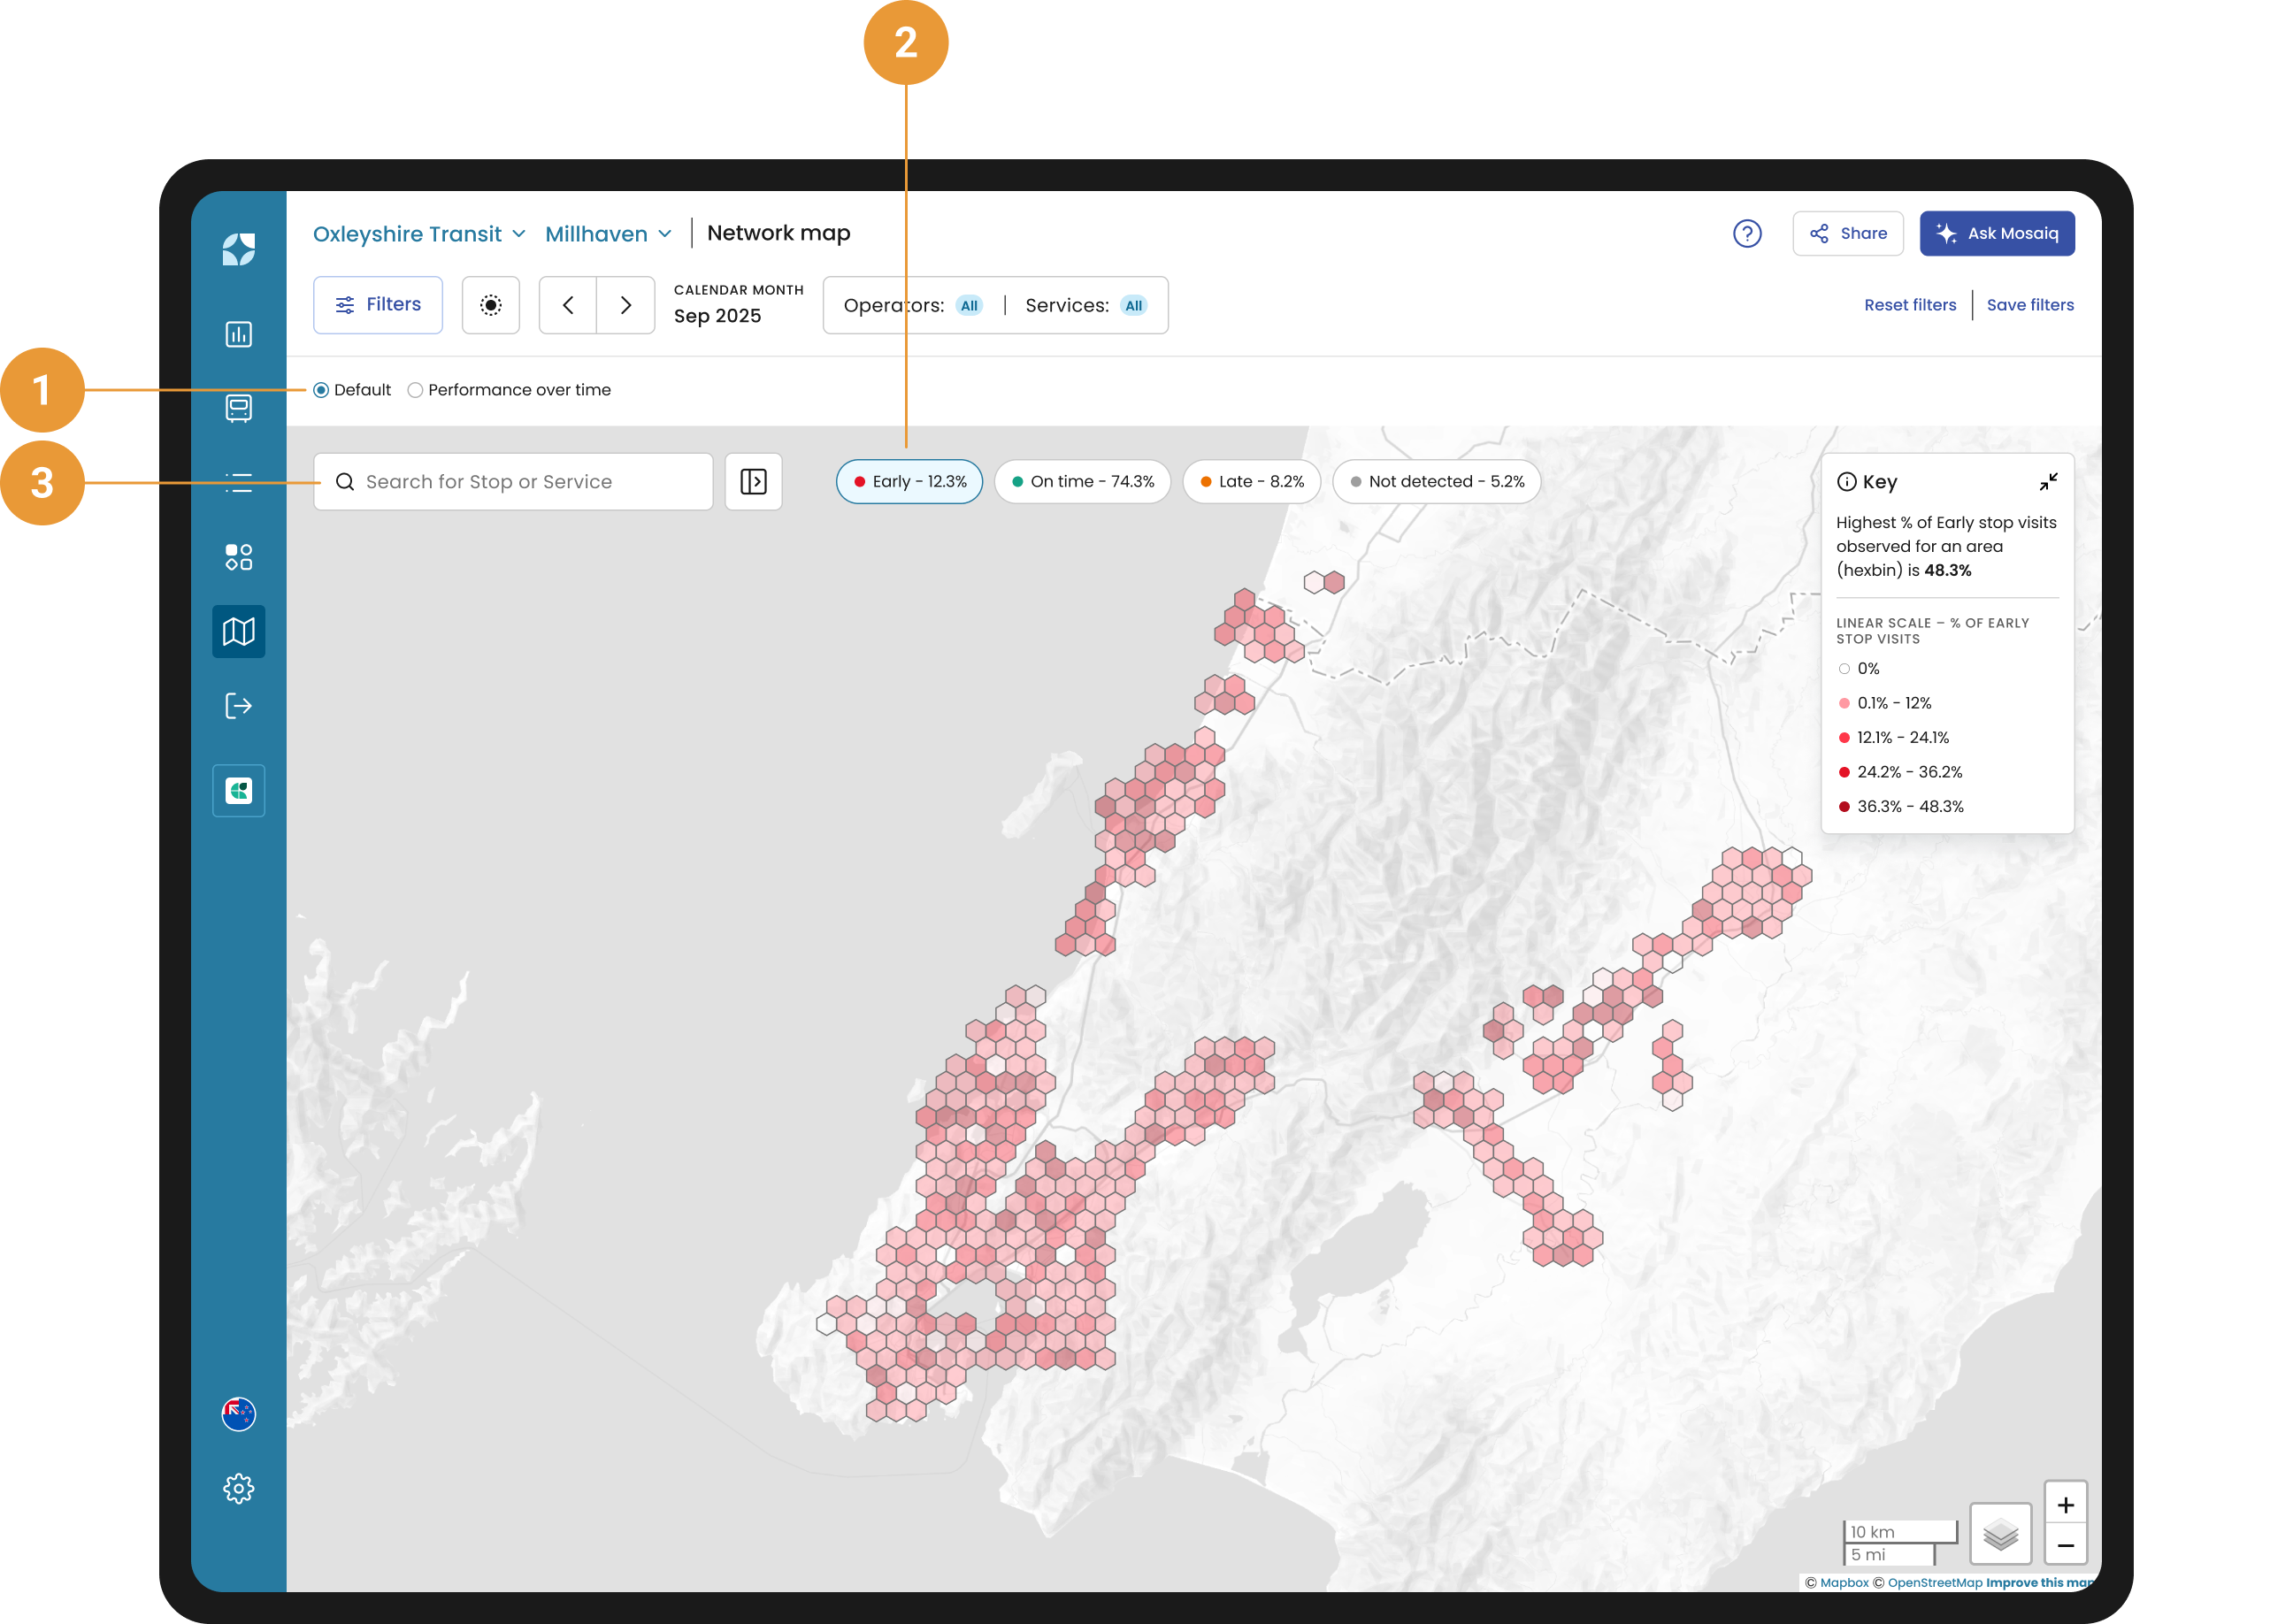
The Default view is displayed when you first navigate to the Network map (1). By default, the map displays Early on-time performance (OTP) (2), and the side panel is collapsed with only the search feature visible (3).
Side panel overview
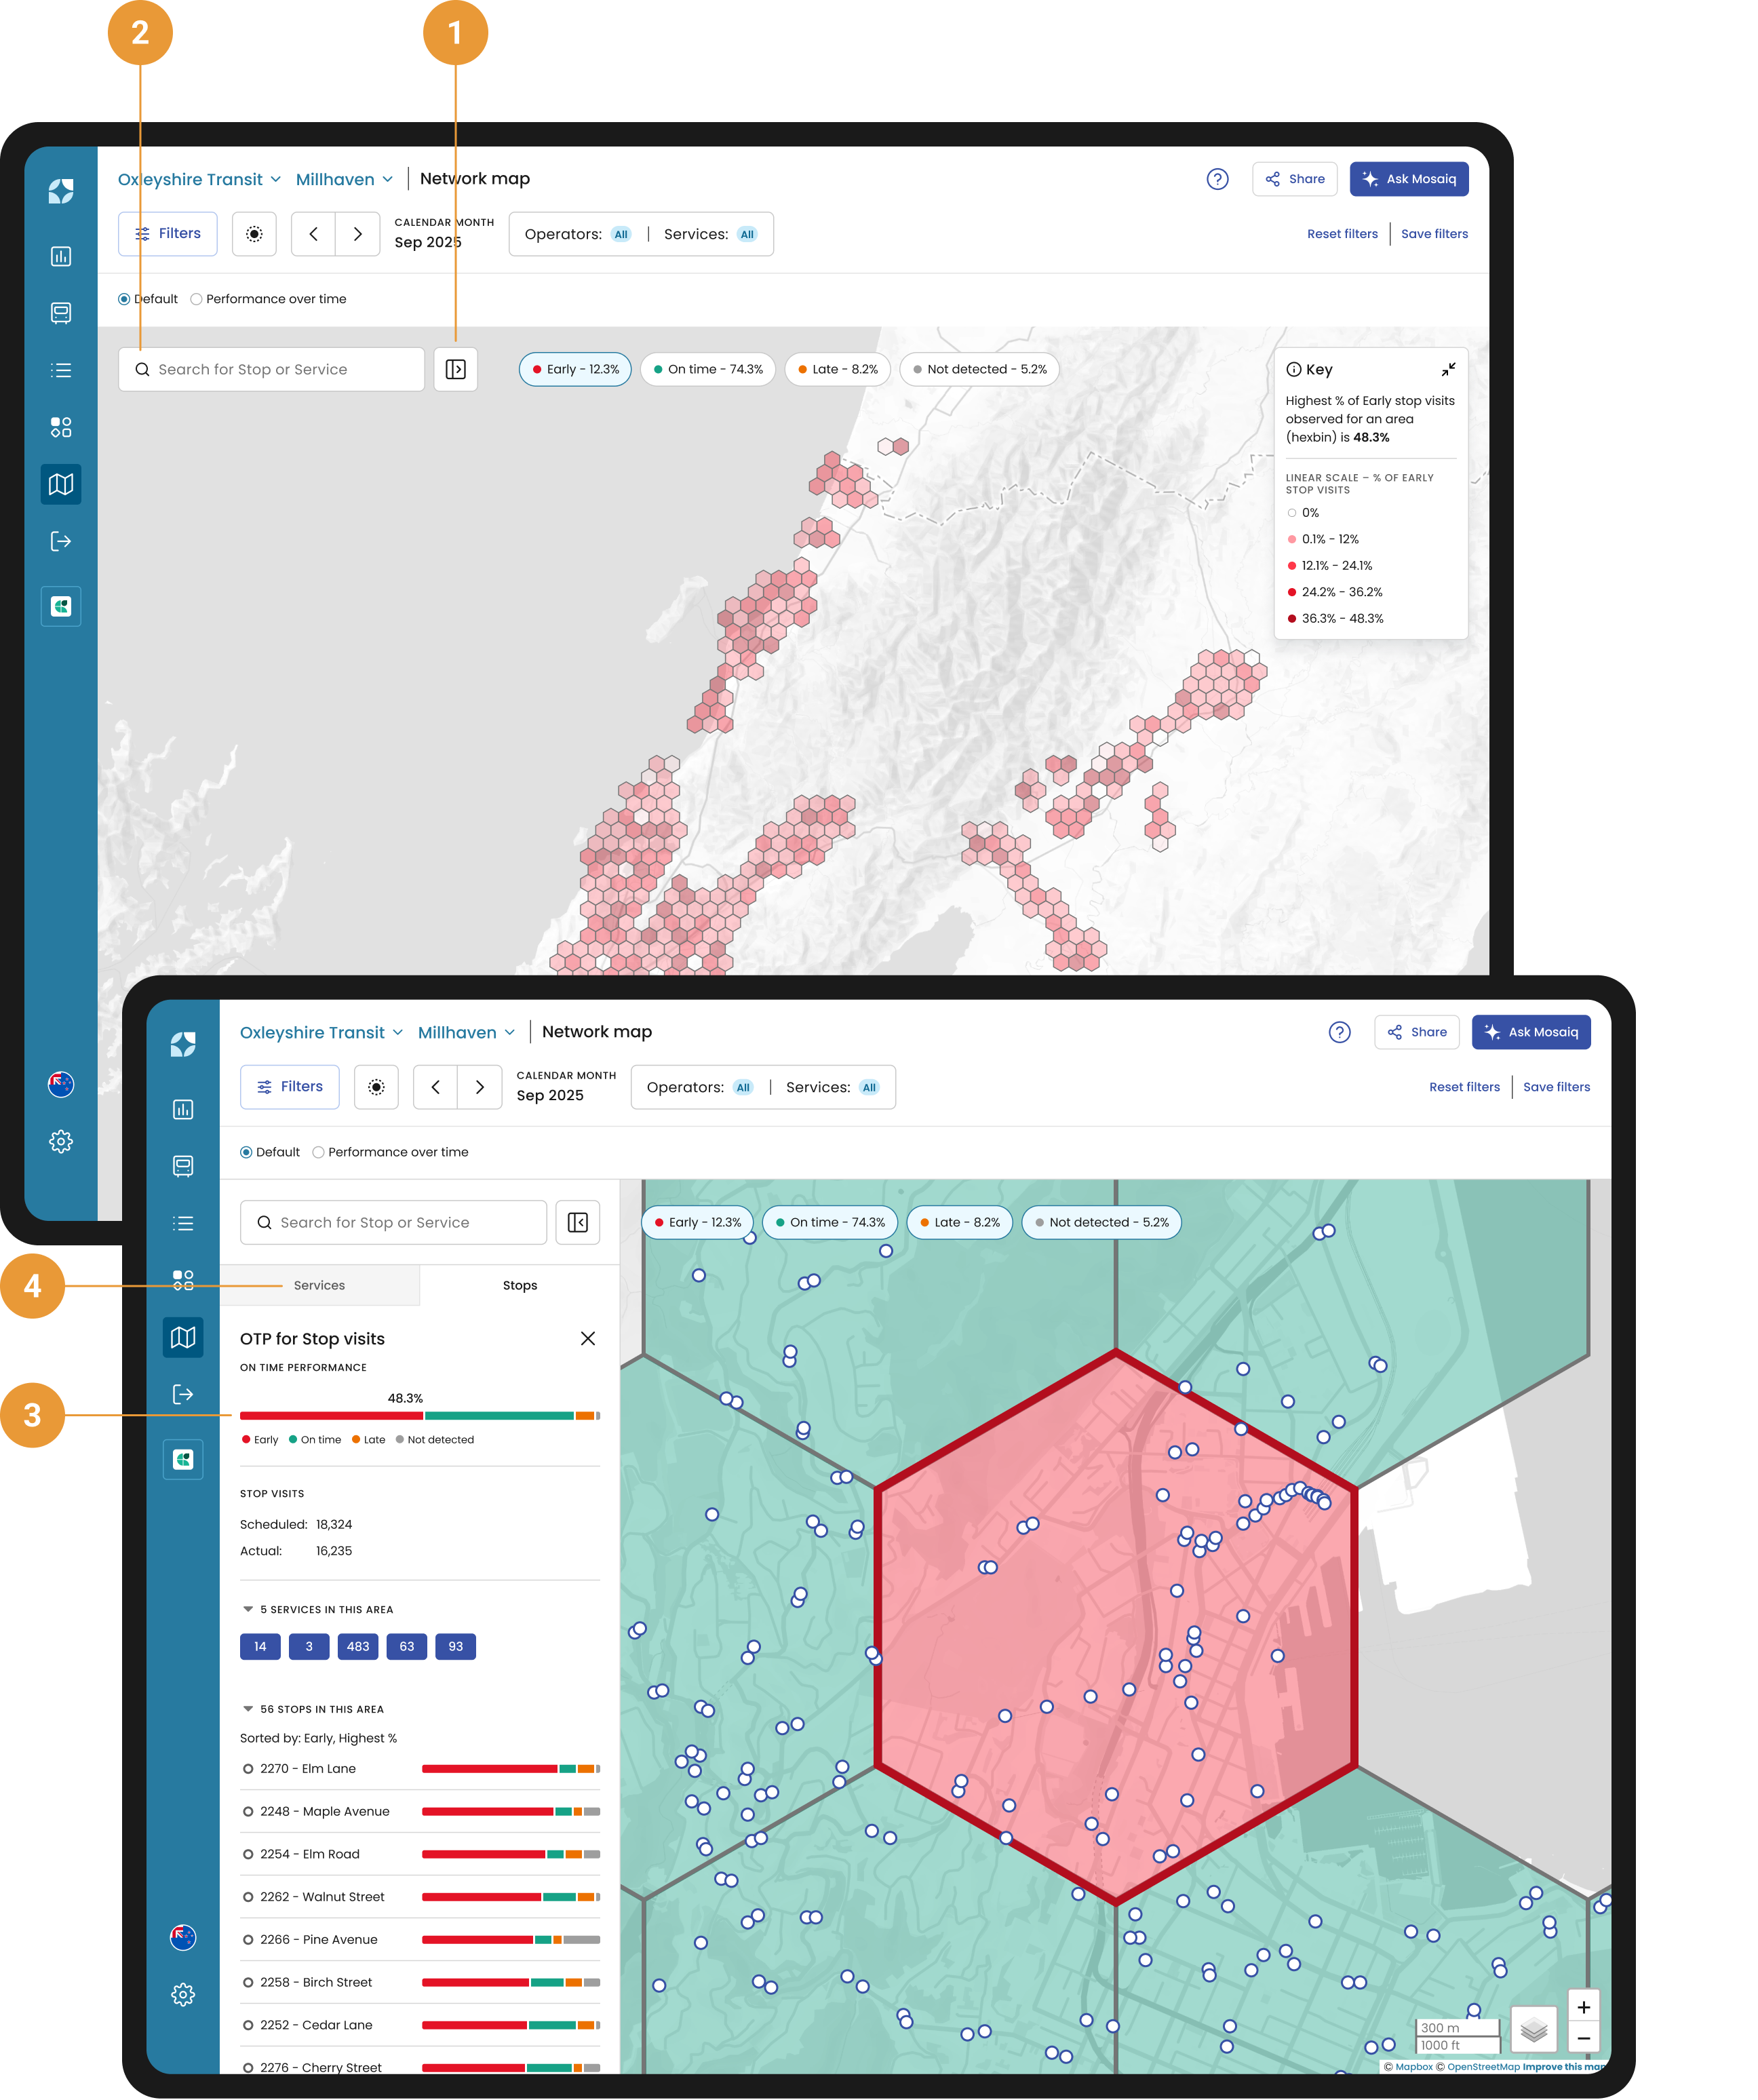
To expand the side panel, either:
-
Click the expand/collapse icon (1). The side panel opens with two tabs: Services and Stops. Neither displays data until you have selected either a hexbin, stop or route, either directly on the map or in the filter hub. You can close the side panel at any time by clicking the

-
Search for a stop or service (2). The Search feature enables you to quickly find a stop and/or service, by name or ID.
-
Click on a hexbin. The map automatically zooms to its location, and the side panel will displays a detailed breakdown of the OTP for all stops within that hexbin (3). This helps you navigate from high-level hotspot detection to stop-level diagnosis in one click. The side panel includes:
-
Stops tab - open by default, it shows:
-
Aggregated OTP for the selected hexbin
-
Scheduled vs actual stop visit counts giving you visibility into data completeness and reliability,
-
A list of stops in the selected hexbin, sorted by the highest percentage of the dominant Early, On-time, Late (EOL)* category. For example, it will be sorted by Early % if early is the leading issue.
-
-
Services tab (4) - click to view the OTP for all Services that visit stops within the selected hexbin.
-
-
Click on a stop. The map automatically zooms to its location, and the side panel will display:
-
Stop details by default (Stops tab), providing a summary of the overall OTP, total stop visits, services at the selected stop.
-
OTP for Services using the selected stop. Click the Services tab to view.
-
To view a particular service, or a number of services, at a glance, either:
-
Click the service in the side panel, or
-
Select the service from the filter hub.
The map then only shows hexbins covering the stops used by the selected services.
*Please refer to the FAQs for more information on how EOL is defined.
Searching for Stops and Services
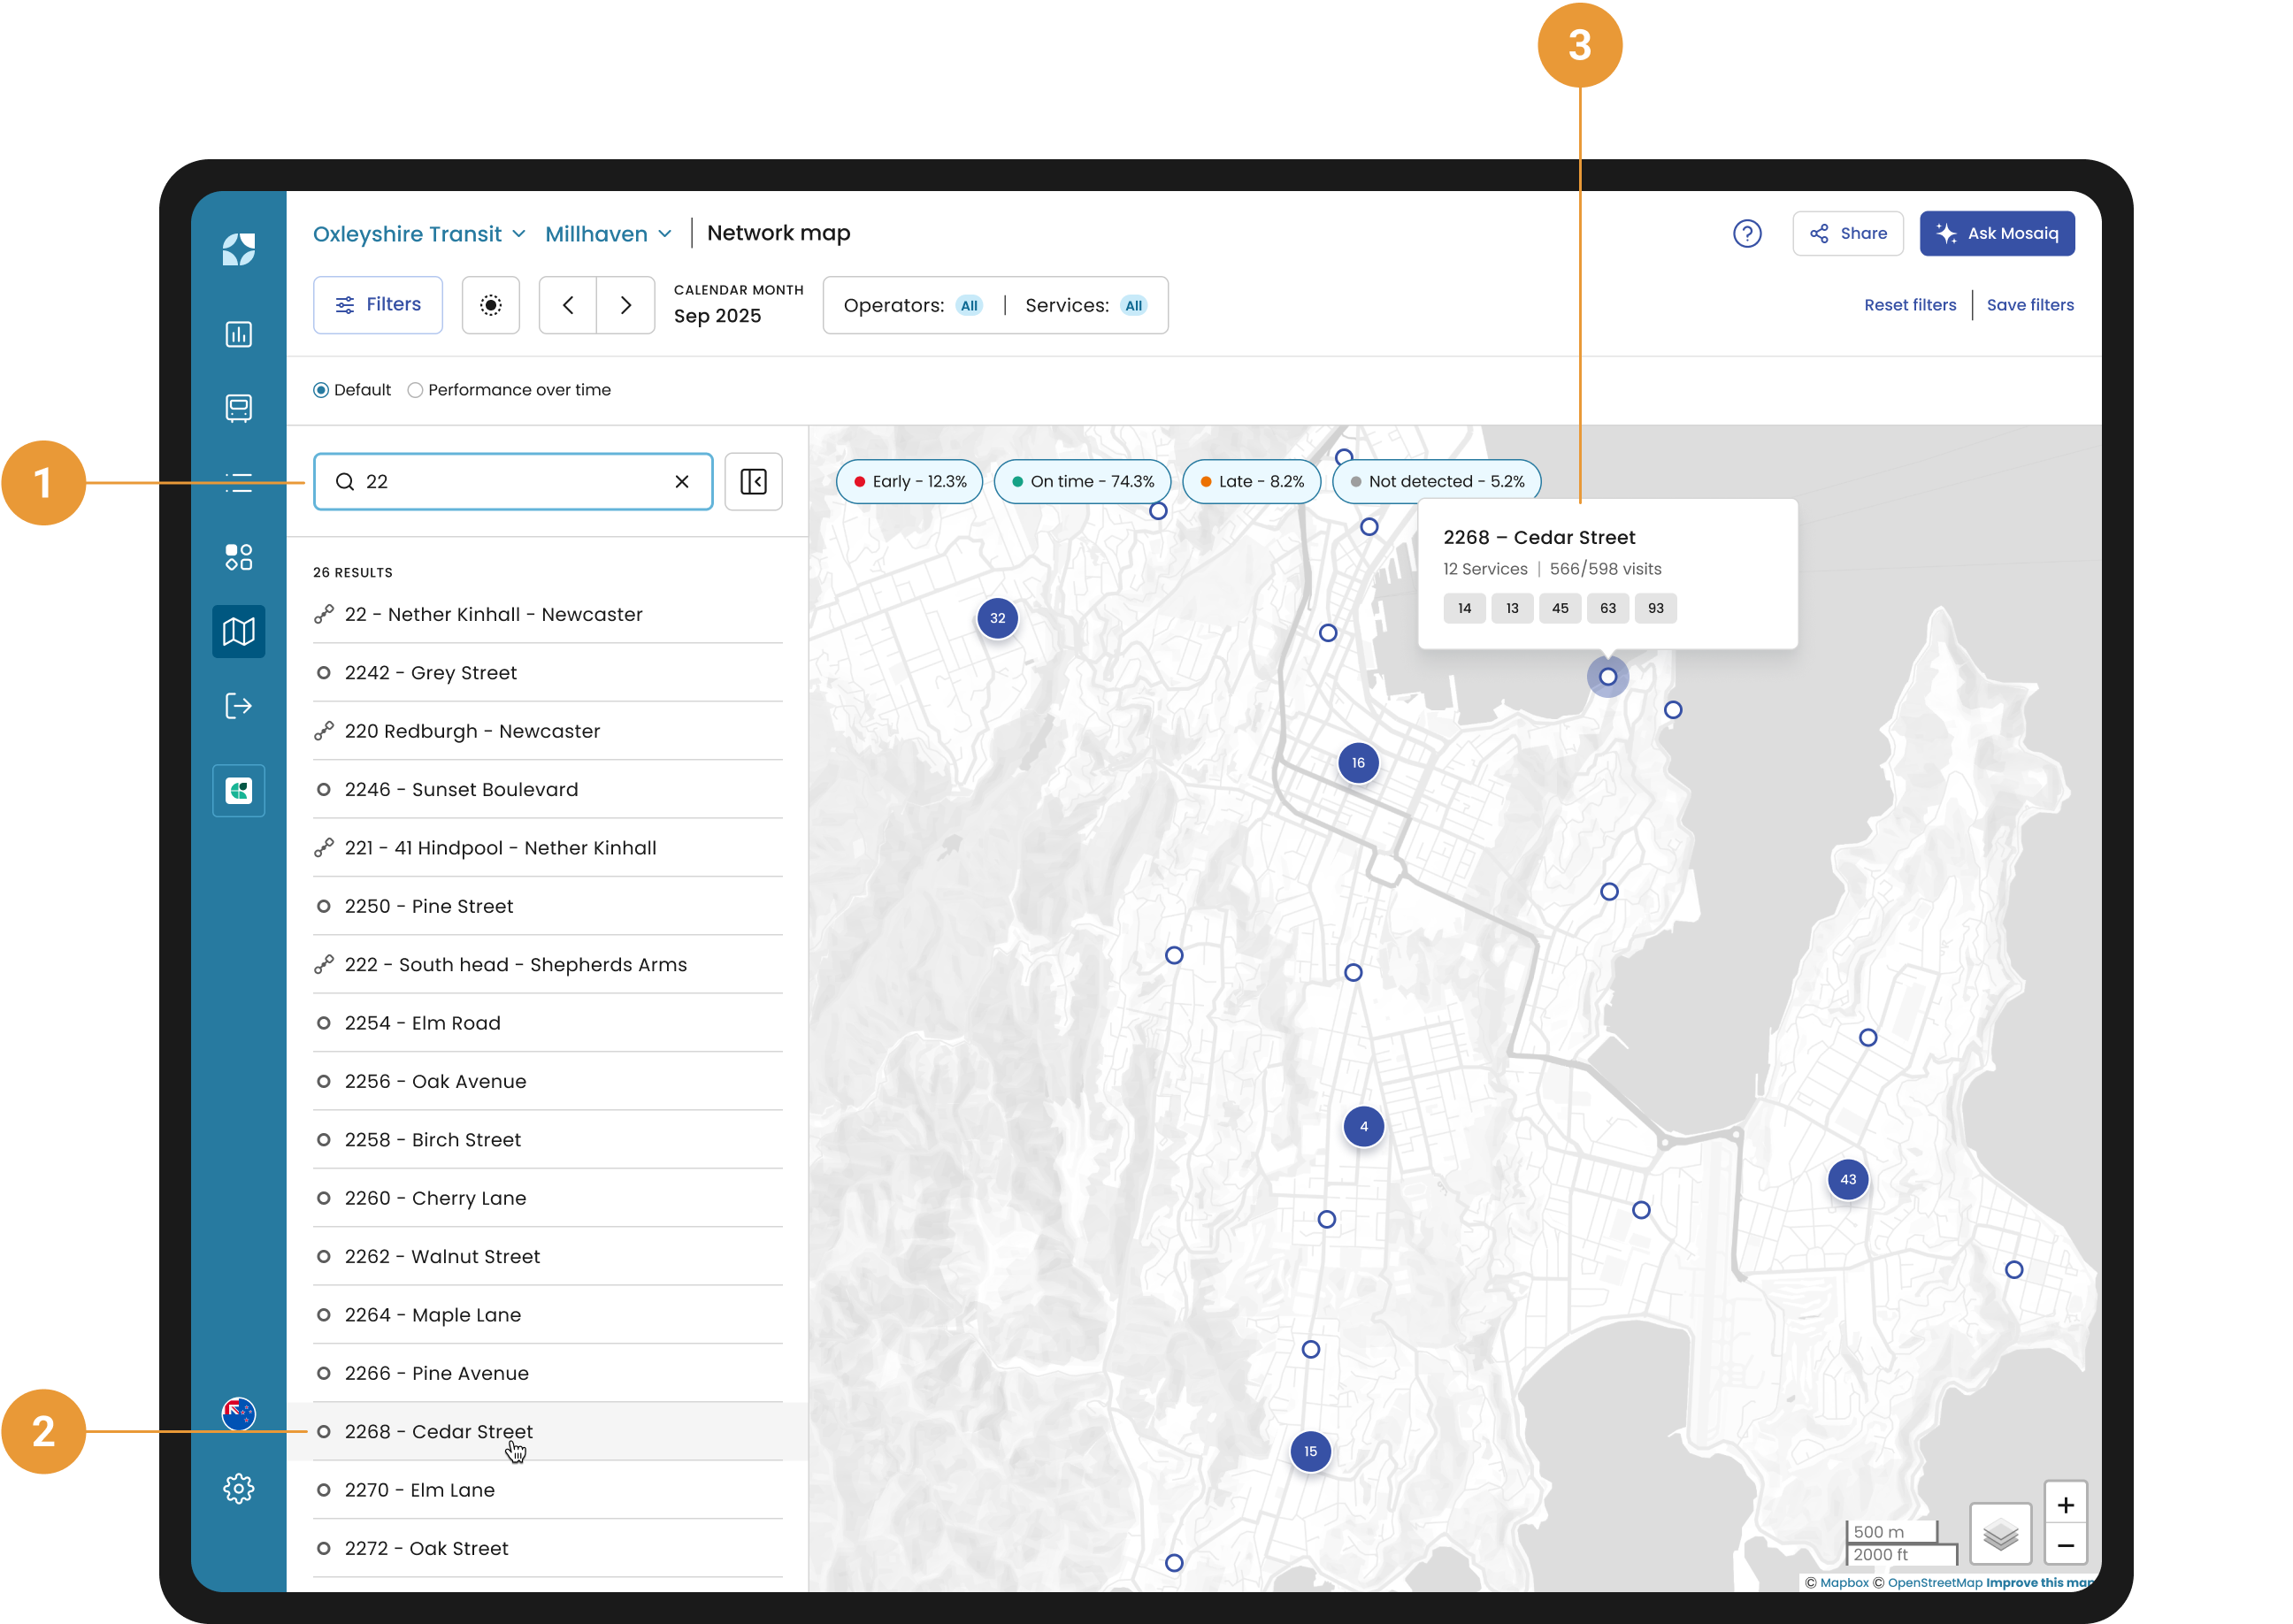
When searching for a stop or service:
-
Search by name or ID. Type the name or ID of the stop or service you’re looking for in the search bar at the top left of the map. (1)
-
Predictive suggestions. As you type, the search dropdown offers predictive suggestions so you can find stops and/or services even if you’re unsure of their exact name or spelling.
-
Direct map interaction. Hover over a stop in the search results (2), and the map highlights its position with a tooltip (3). Hover over a service in the search list results, and the map highlights its route.
When you select a stop or service, the map automatically zooms in to its location, providing a clear view of the stop or service and its surroundings.
Side panel - Stops tab
The Stops tab allows you to investigate stops in more detail, including each stop’s OTP and the services that visit it.
-
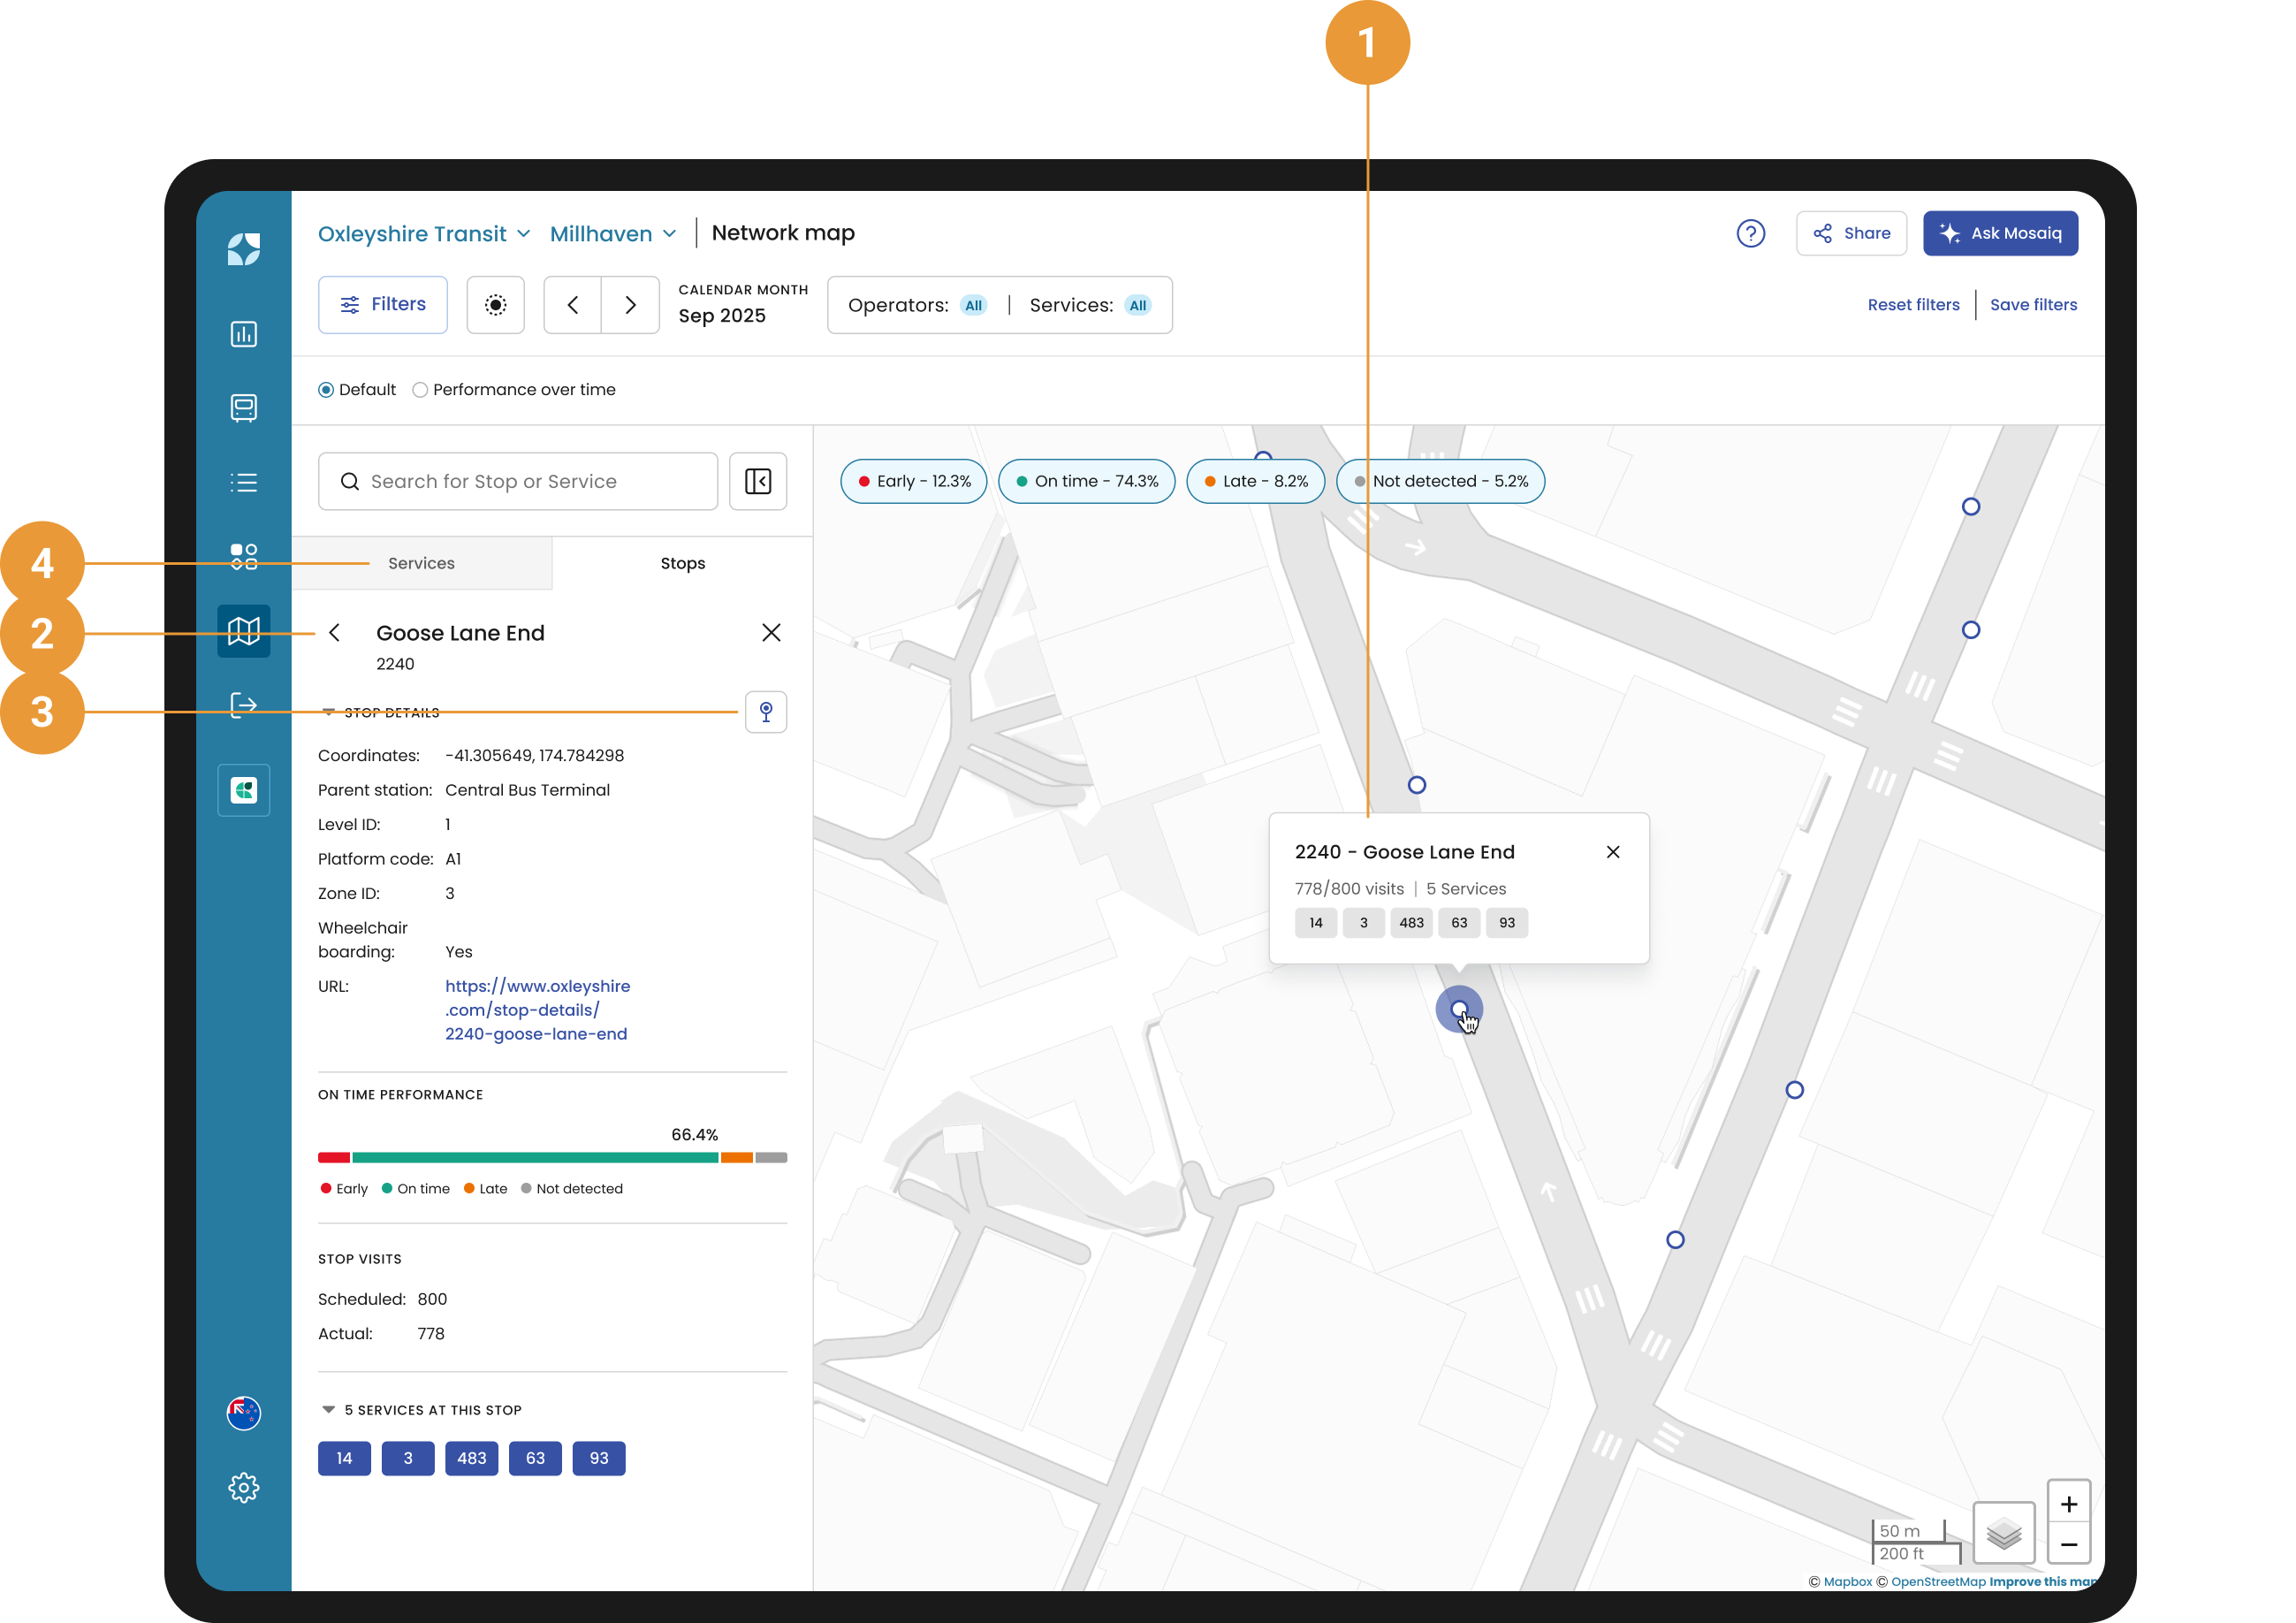
Hover over a stop on the map to get an instant pop-up showing key information (1), including:
-
Stop ID and name.
-
The number of actual visits compared to the expected visits.
-
A list of services in your network that use this stop.
-
-
Click a stop to open the Stops tab in the side panel with more detailed stop information (2), including:
-
The OTP of the stop.
-
Additional data to help you assess its performance.
-
To dive deeper into the stop’s details, click on the View Stop Details icon

-
Switch to the Services tab to see all the services that visit the stop (4).
To view details for another stop, click a different stop on the map. There’s no need to close the panel beforehand.
Side panel - Services tab
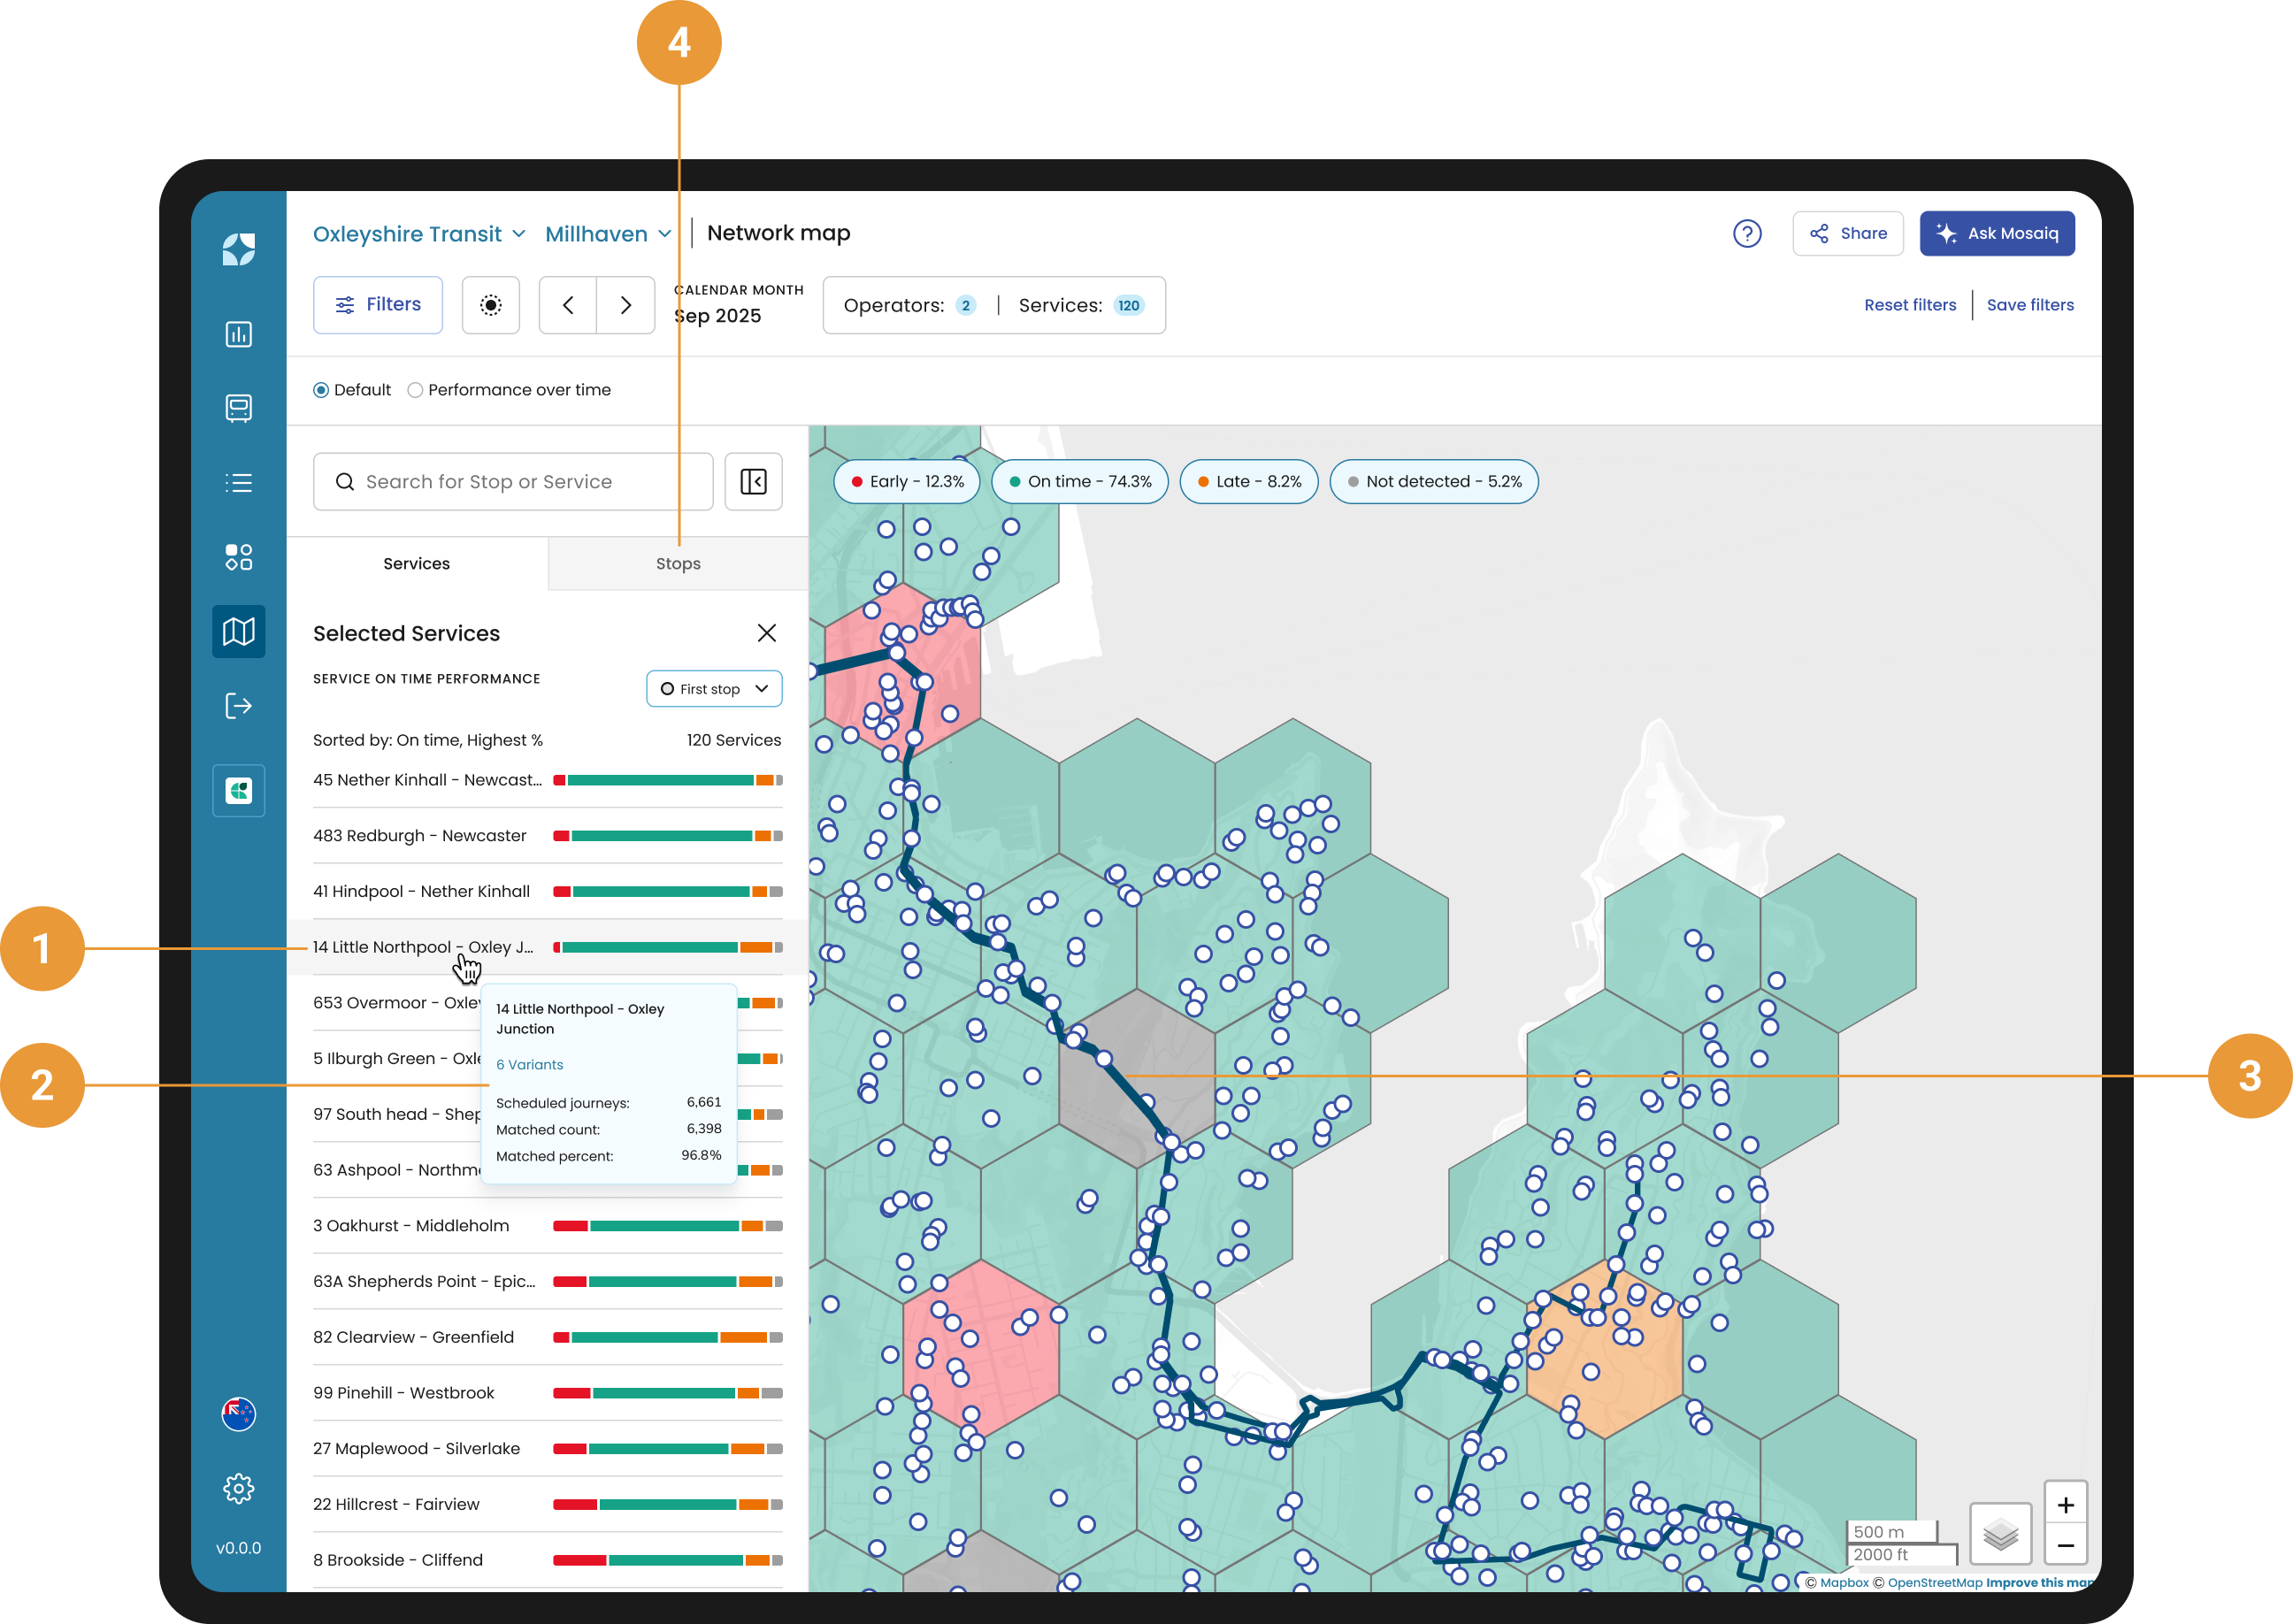
The Services tab allows you to investigate the geographic locations of services within your network. It lets you review how each service and its variants perform at the first and last stops, visually trace the connections between stops along each route, and open detailed service or stop information.
-
Move your cursor over the services within the side panel to highlight them on the map (1). Hovering over the service reveals data quality details (including scheduled count, matched count, and matched percentage) for each service (2) and displays the connections between stops along the route (3).
-
Click a service to view its variants. Hover over the variants to reveal data quality details and connections between stops.
-
Click a variant name in the side panel to open its Service details page.
Switch to the Stops tab to see all the stops that are used by the service (4).
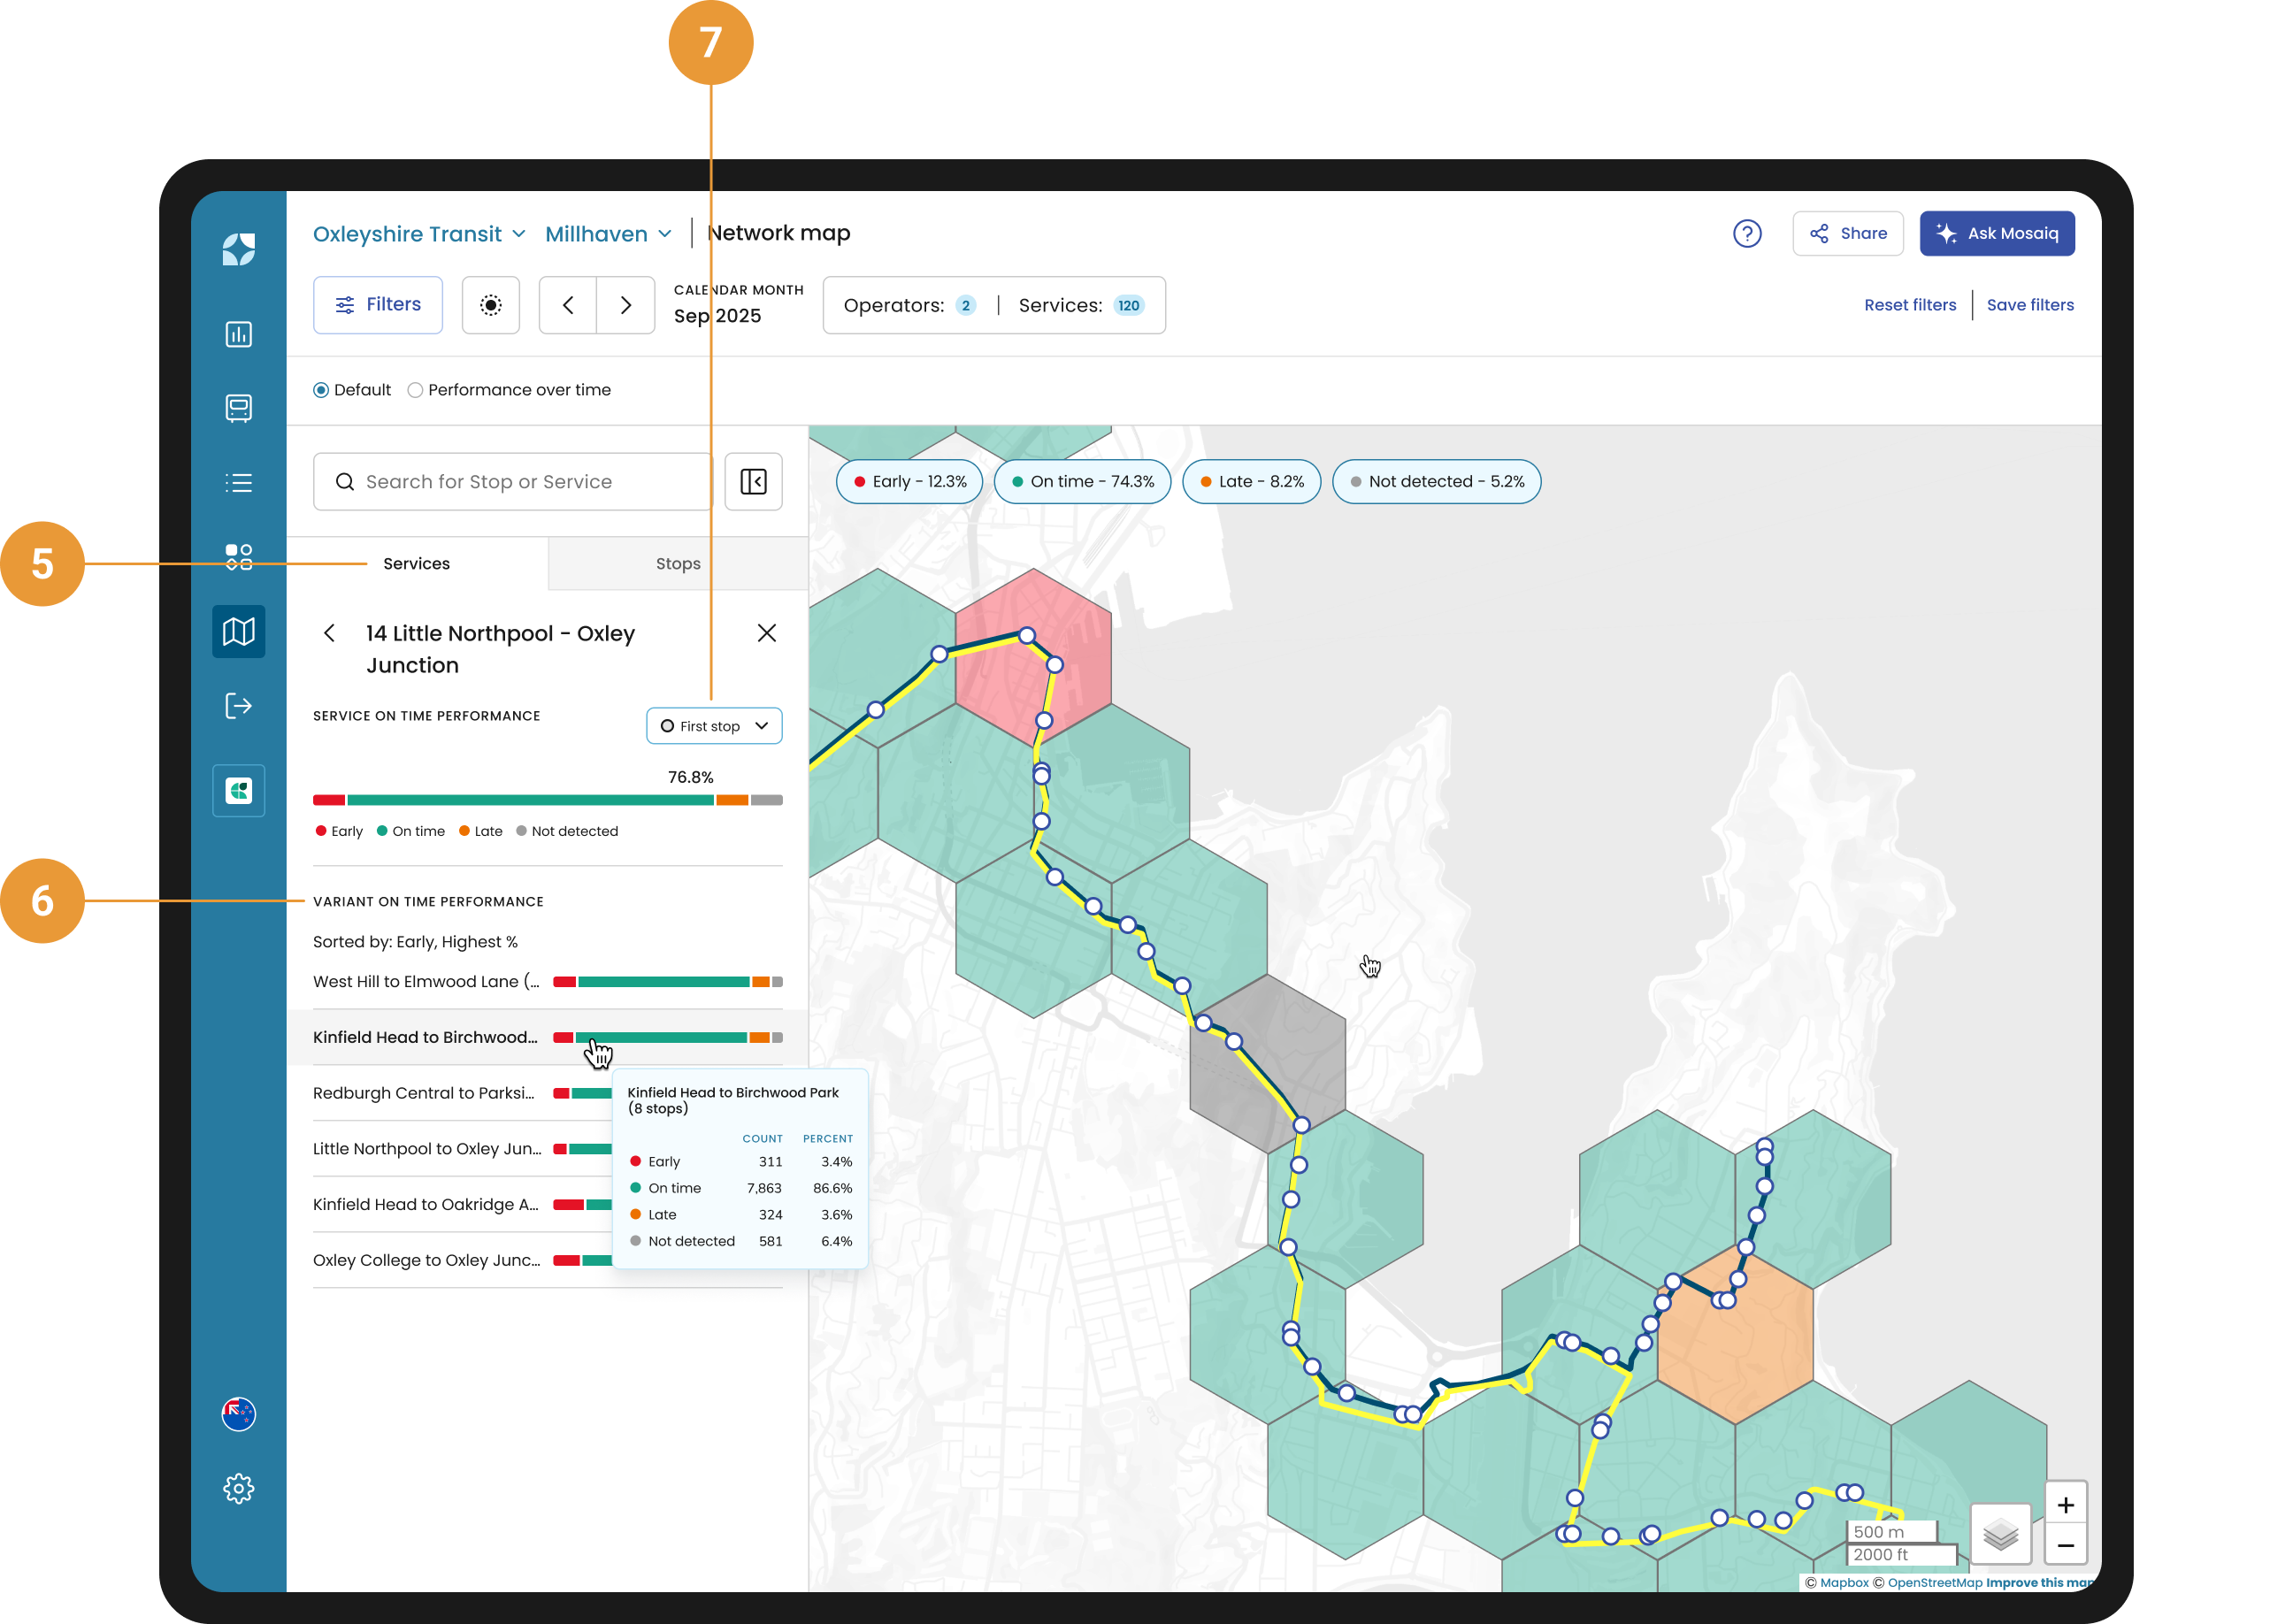
When you select more than one service, the Services tab (5) shows all selected services, and the Stops tab lists every stop used by those services. By default, stops and services are sorted by their Early OTP, making it easy to identify punctuality trends across your network.
When you select a single service, the Services tab displays its variants, while the Stops tab lists all stops used by the chosen service and its variants (6).
Use the dropdown to switch between first-stop and last-stop OTP (7).
If your schedule data files include route shapes and colours, Mosaiq Insights displays them (3).