
The Running times (by time band) chart shows how far running times ran over or under schedule at different times of the day. Use it to find the times of day where your schedule doesn't match how services actually run, and to pull band-level figures straight into your running time analysis reports.
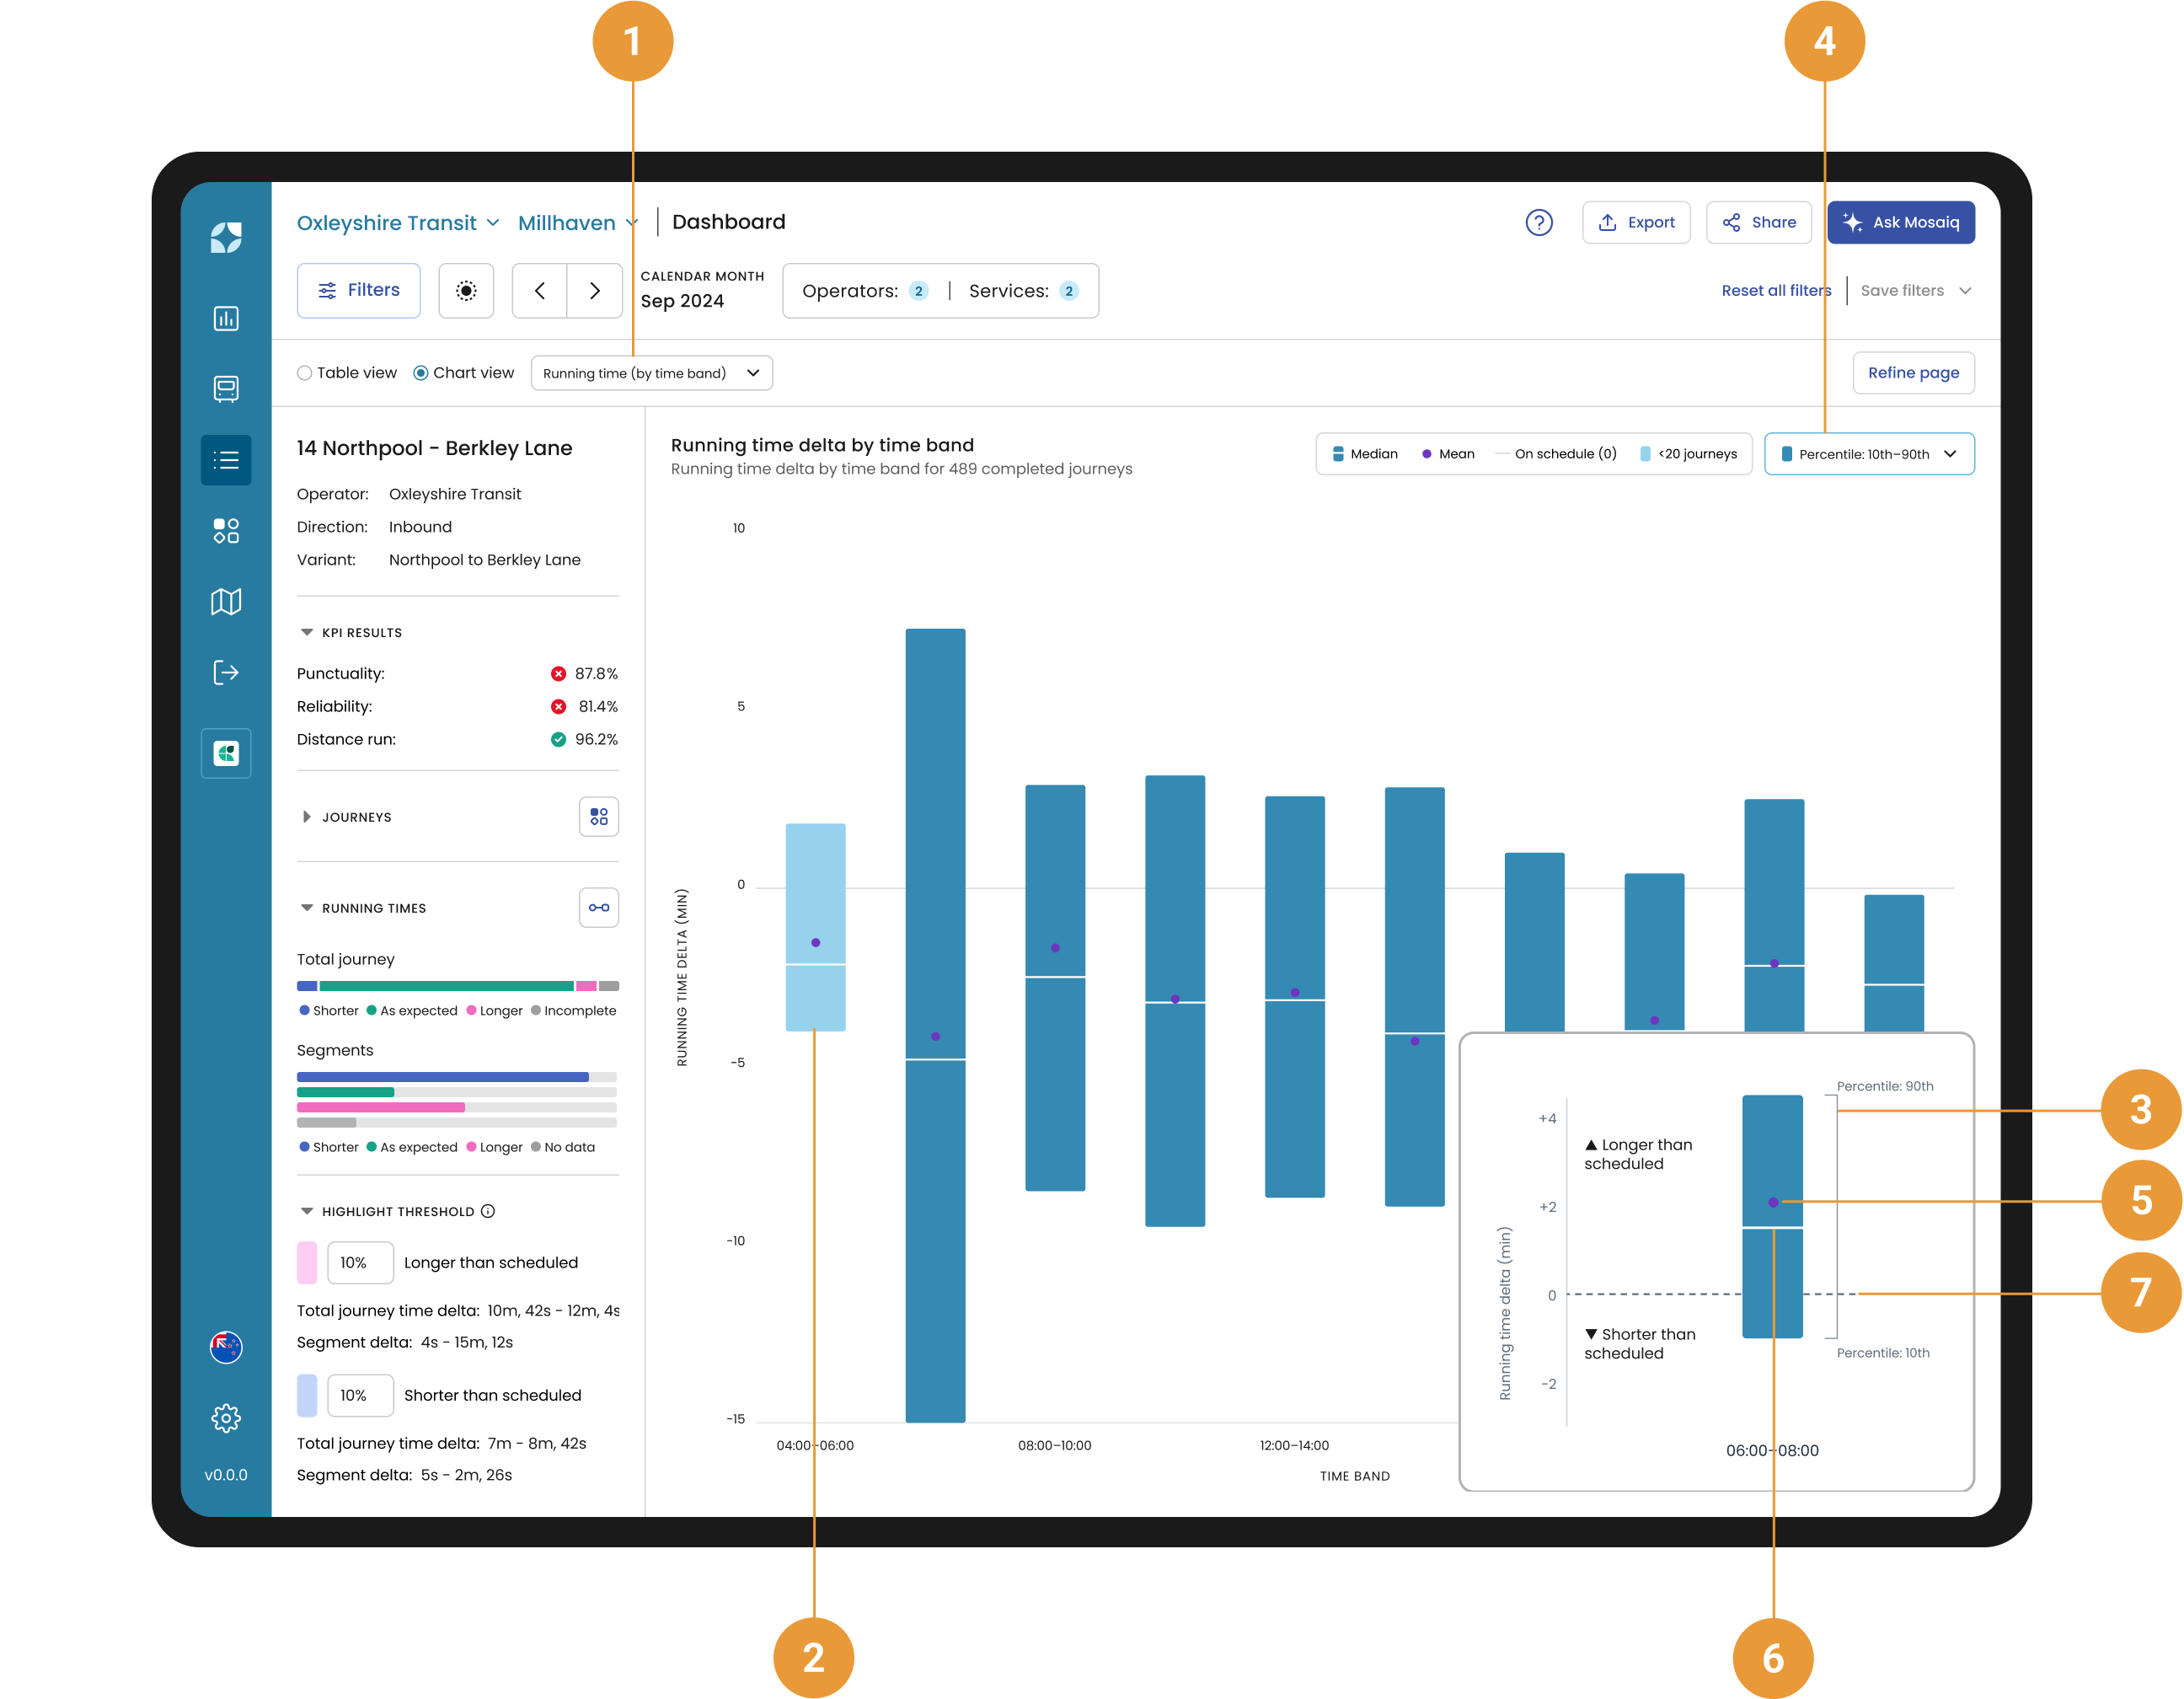
You can access the Running times (by time band) chart via the Chart view dropdown in the sub-header (1).
A journey sits in the band its scheduled start time falls in. To narrow into only those trips within a specific time band, either:
-
Click a bar to open Running times (along journey) chart for the journeys in that band so you can see where along the route running time is gained or lost. The band is applied as a Time band filter and shown as a chip beside Refine page. Any scheduled start times you'd chosen outside that band are removed.
-
Open the Refine page button and select desired time band(s).
Bars which contain fewer than 20 journeys are highlighted (2).
Each bar is one two-hour time band. Use it to see how far journeys in that time band ran from schedule.
-
The bar (3) covers the middle range of journeys, from the 10th to the 90th percentile by default. Change the range with the percentile dropdown (4).
-
The tick is the median (6) and the dot is the mean (5).
-
The zero line is on schedule (7). Above it, journeys took longer than scheduled; below it, they were quicker.
-
A short bar means journeys in that band ran consistently. A tall bar means they varied a lot.
A short bar sitting on the zero line means the schedule matches how journeys actually run.
Selected bar tooltip
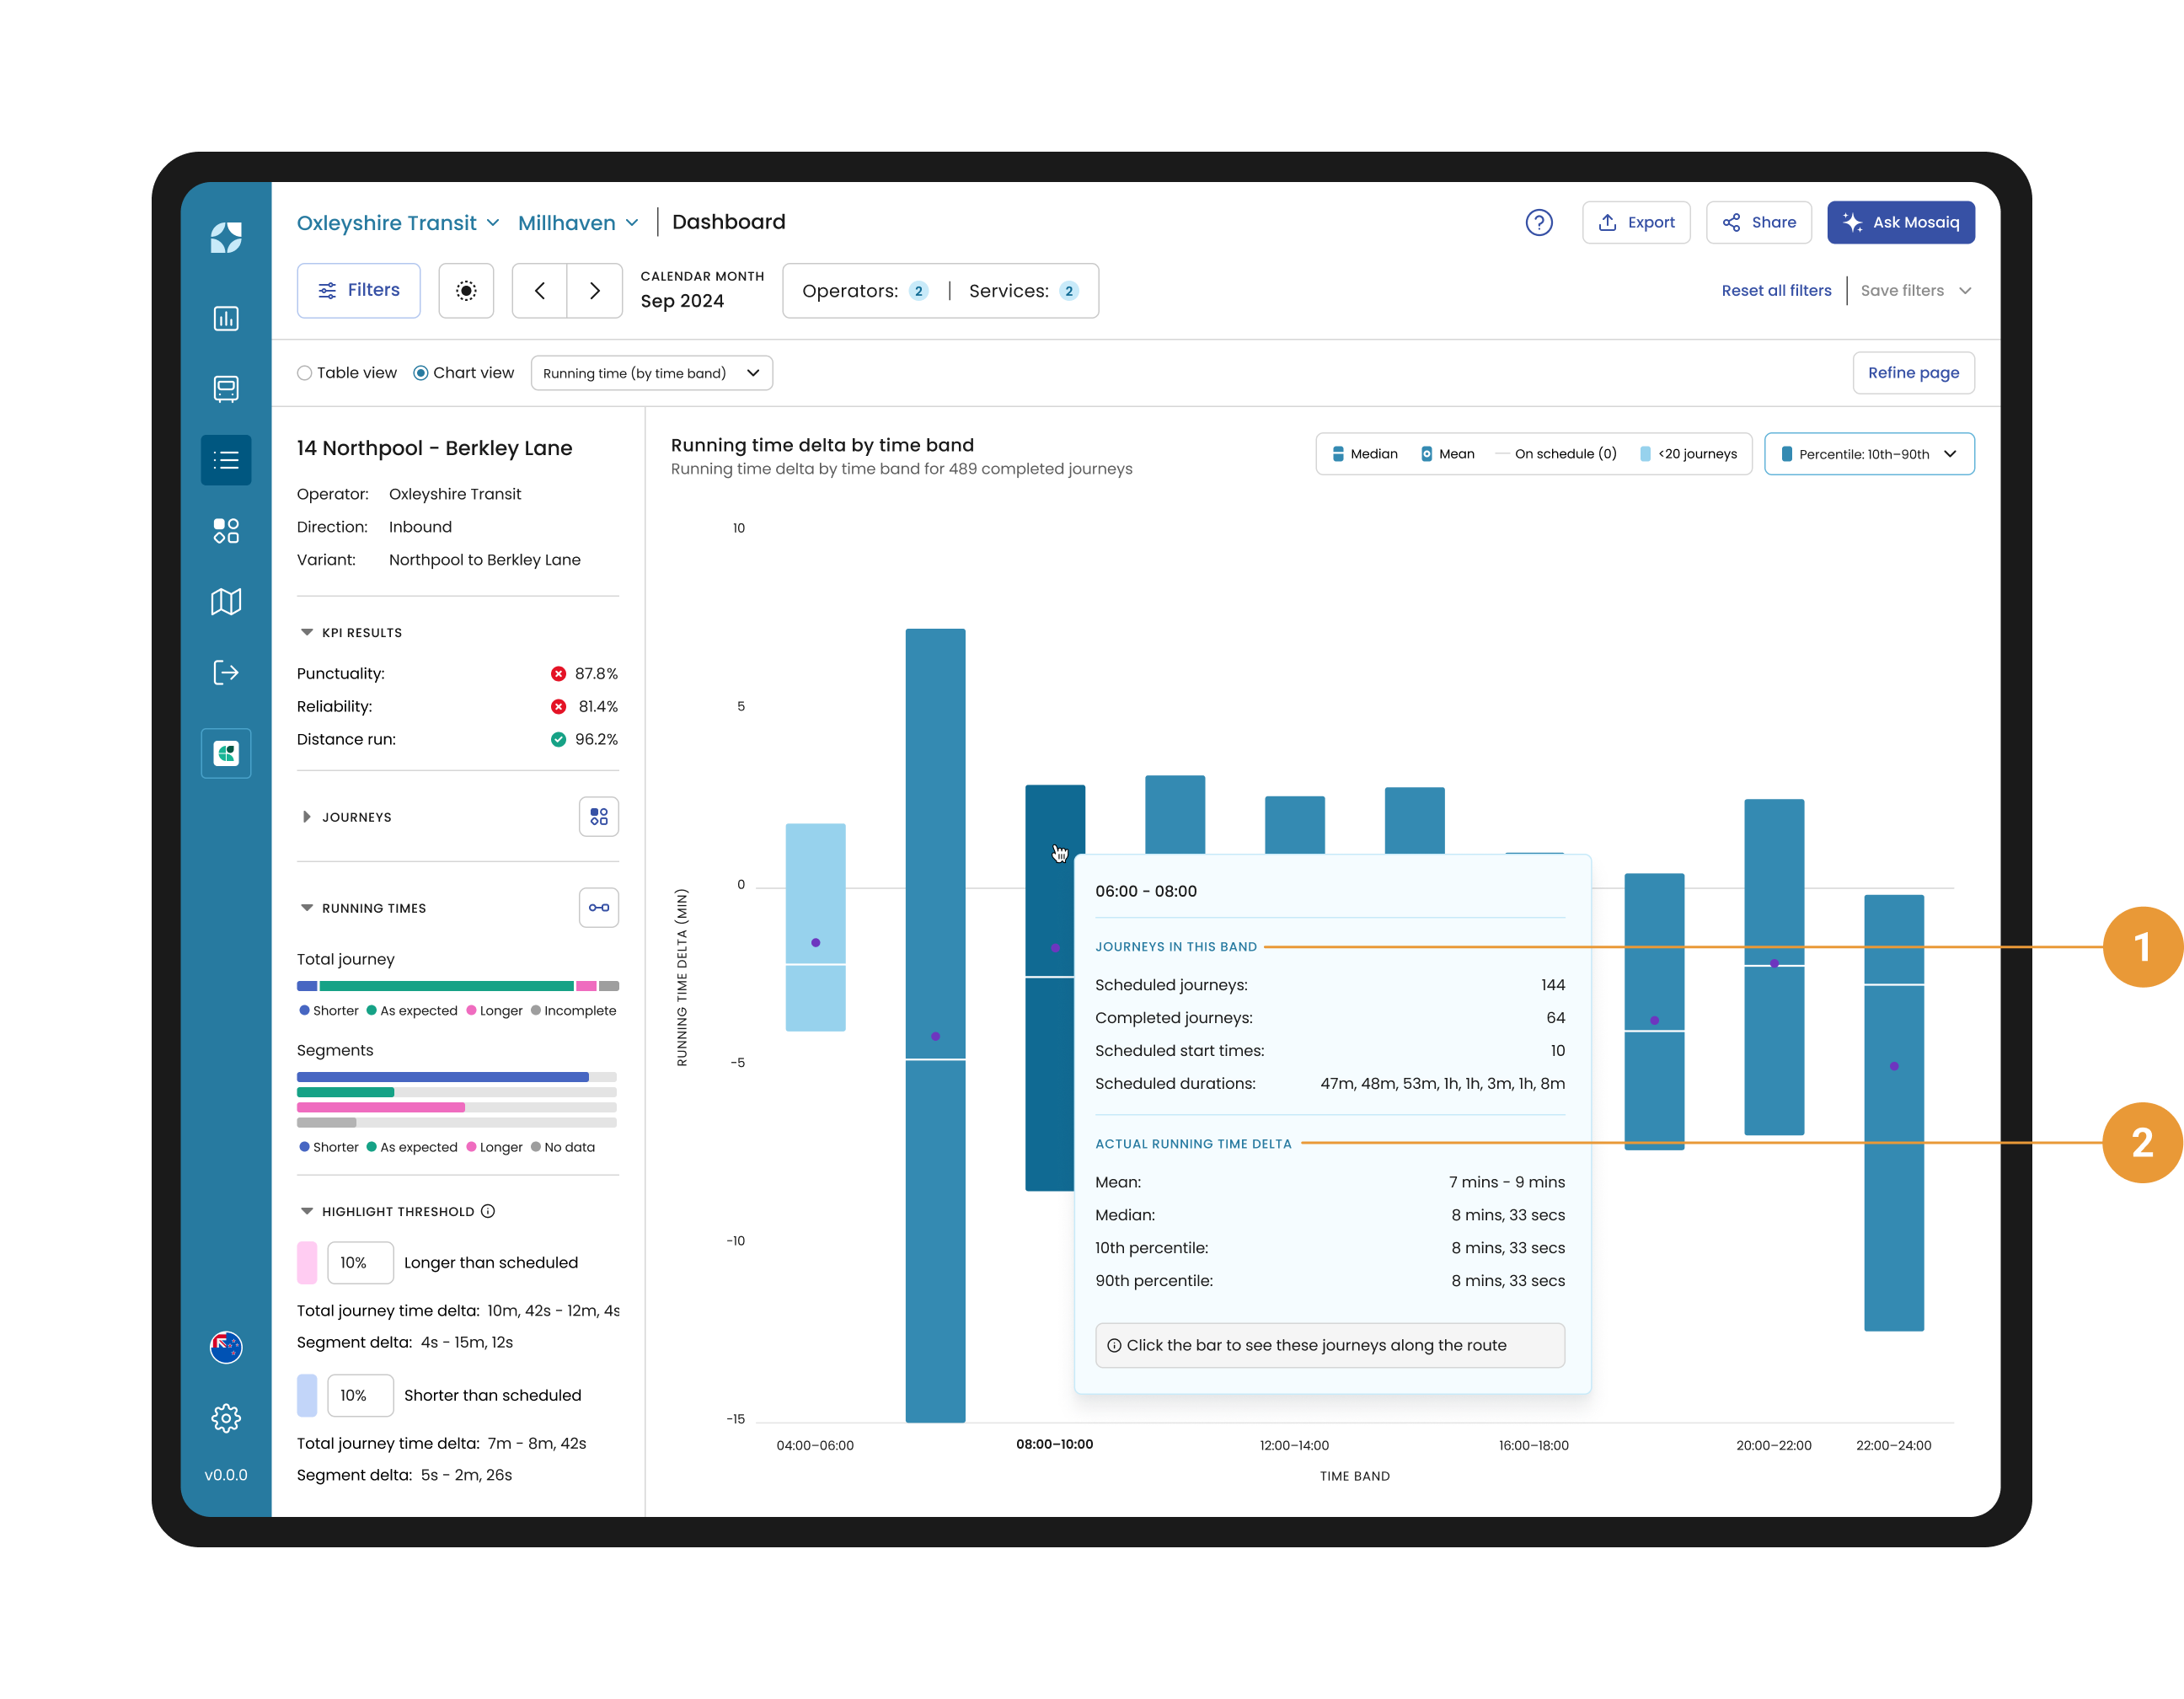
Hovering over a band in the chart will show a tooltip with additional information.
The content within the tooltip includes information relating to the performance of the highlighted time band:
-
Journeys in this band (1) - The number of scheduled journeys, completed journeys, and scheduled start times within the hovered time band bar. When there are more than one scheduled durations, these are also listed.
-
Actual running time delta (2) - The mean, median, and the lower and upper percentiles for the selected time band bar.
Missing values show as "---".